From the archive · Substack
The Complacency Wave Is Peaking
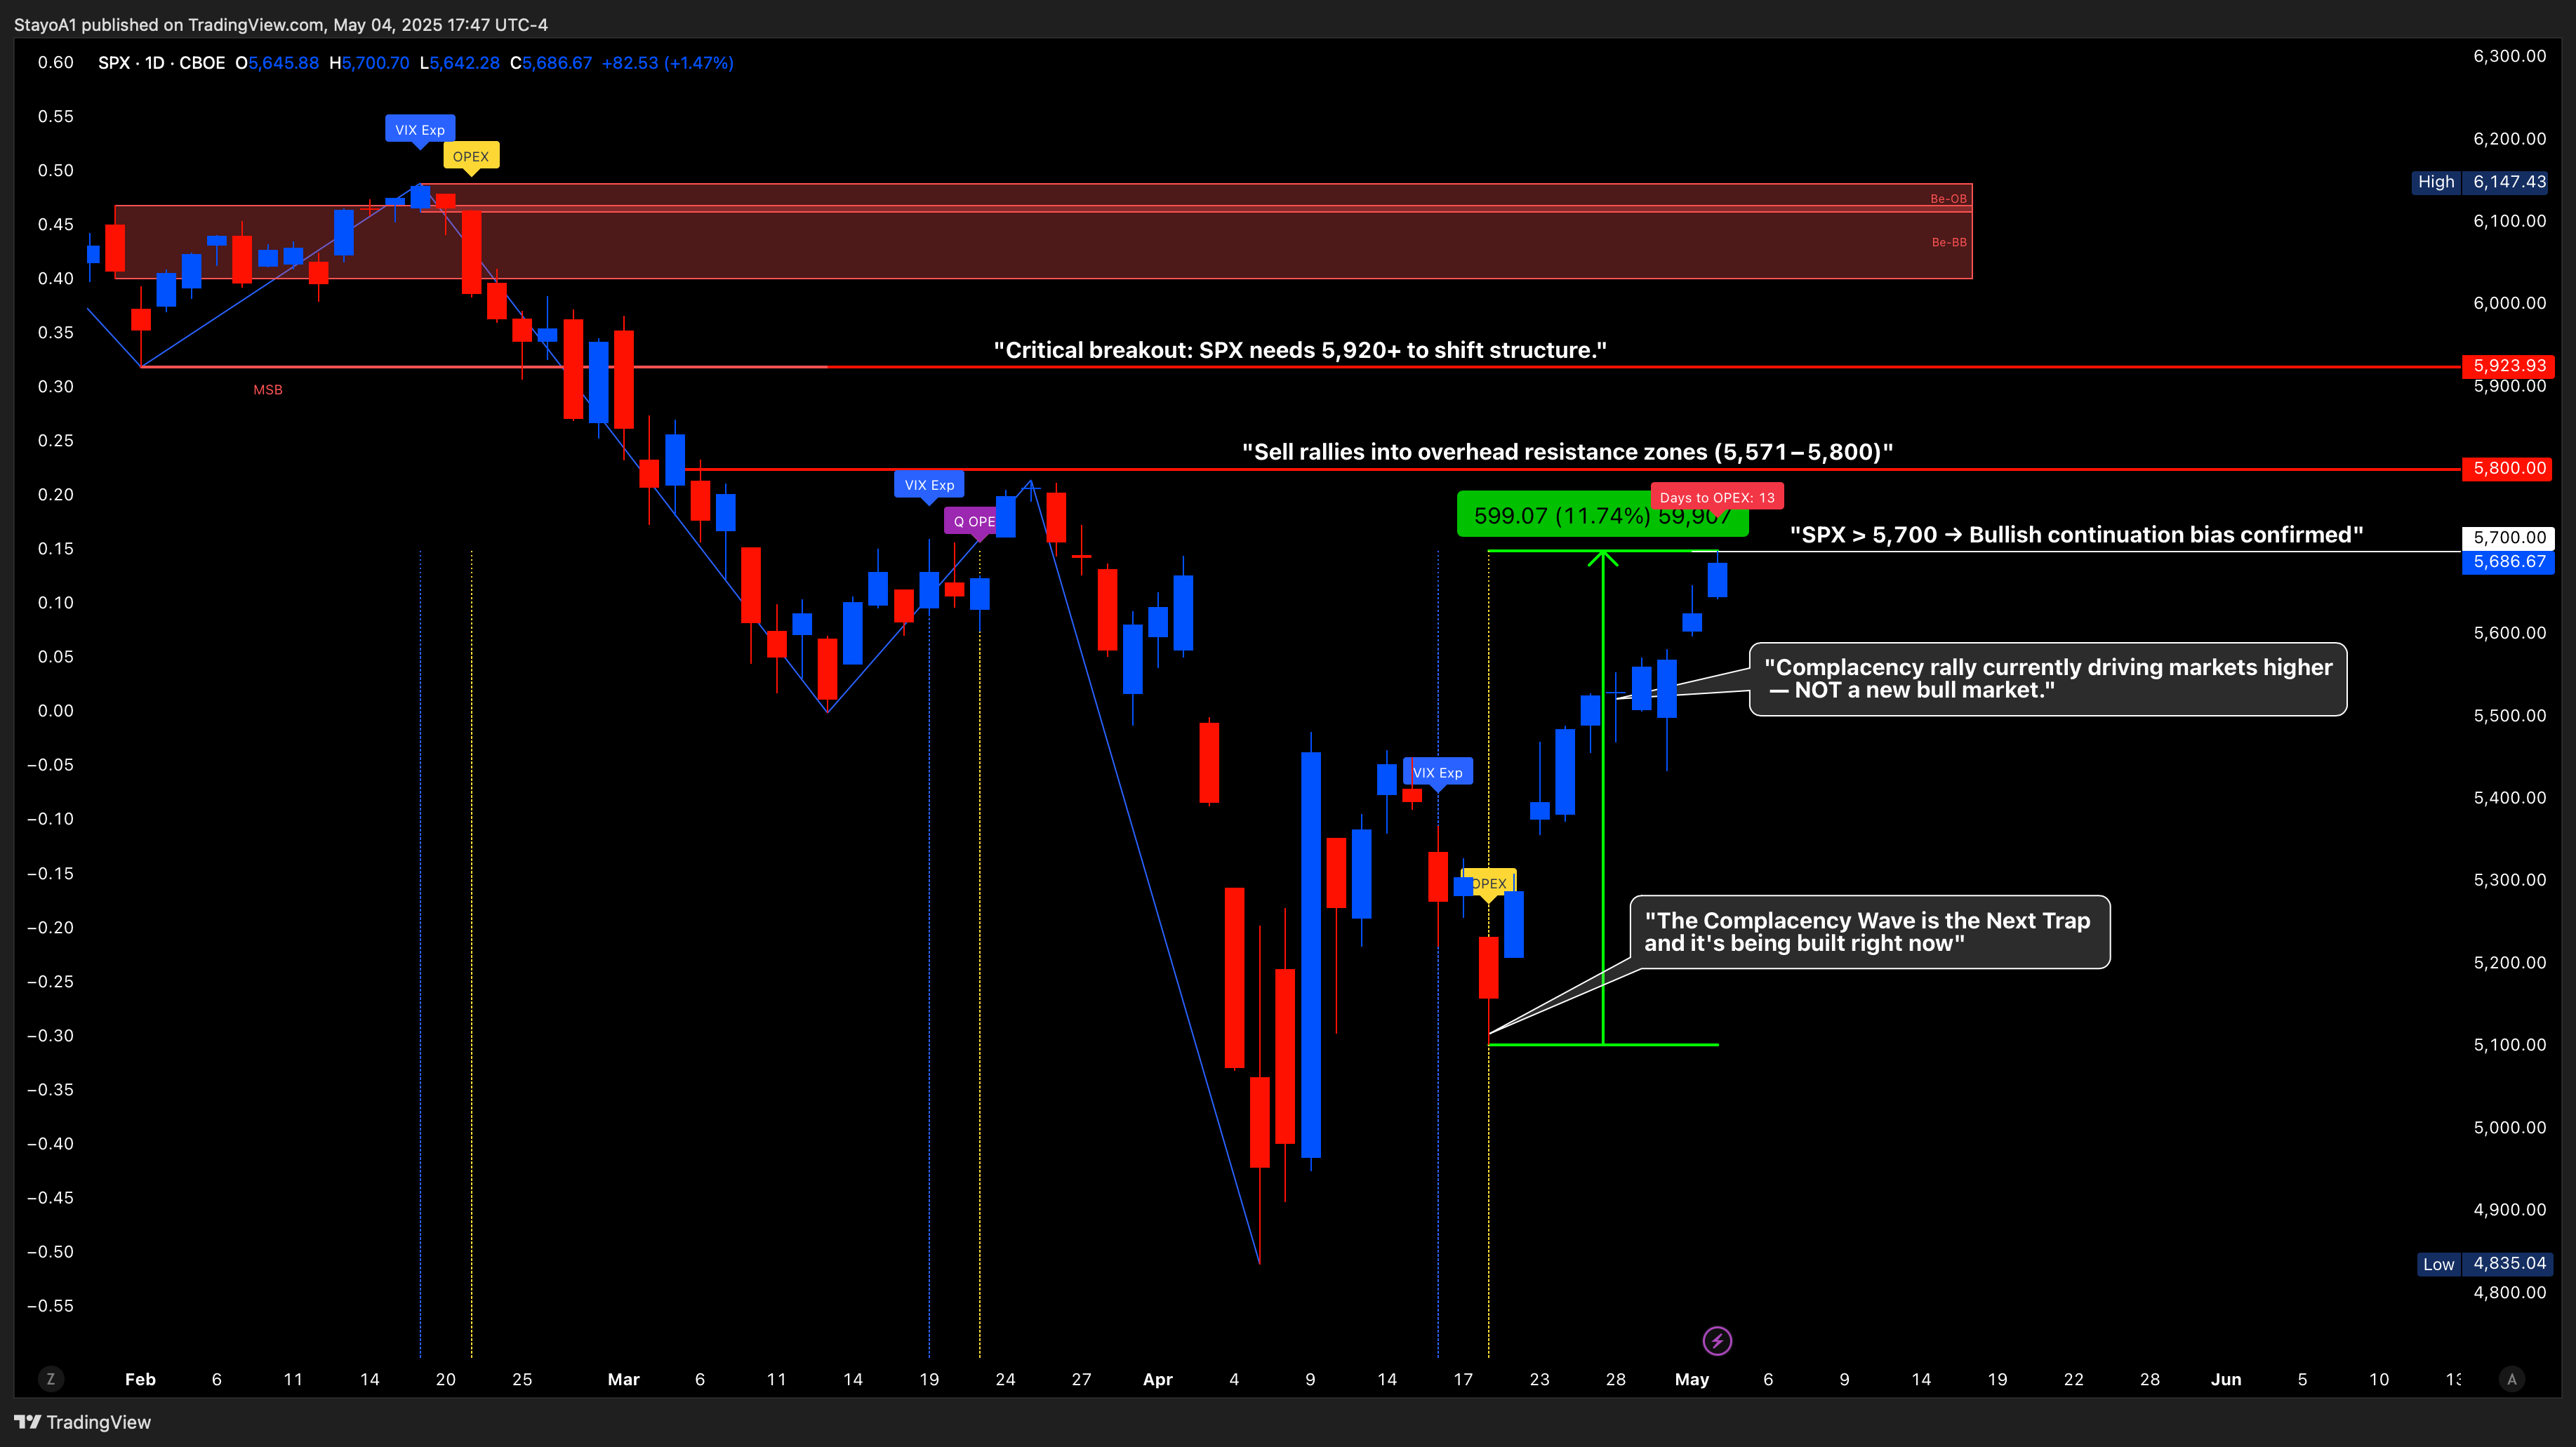
On April 21st, I called the start of the complacency wave — not weeks late like everyone else, but at the start. Back then, $SPX was trading near 5100. Since then, we’ve rallied nearly 11% to 5700, right into a zone of resistance I mapped ahead of time.
I said this was a trap, not a new bull market.
I said this was hollow optimism built on weak internals.
I was right.
Let’s break it all down.
 Open original image in a new tab
April 28 Review – Everything’s Playing Out
In my last post, I:
Fact-checked my market call with proof – $SPX rallied exactly into my resistance range.
Said the complacency wave was active and would mislead many. Check.
Warned that we’re not in a new bull market unless $SPX breaks 5920. Still true.
Highlighted deteriorating breadth, rising unemployment, and weak earnings – all ongoing and worsening.
Since that post, price action has done exactly what I said:
→ It squeezed higher, but without structural confirmation.
→ It’s now pressing into resistance, right on cue.
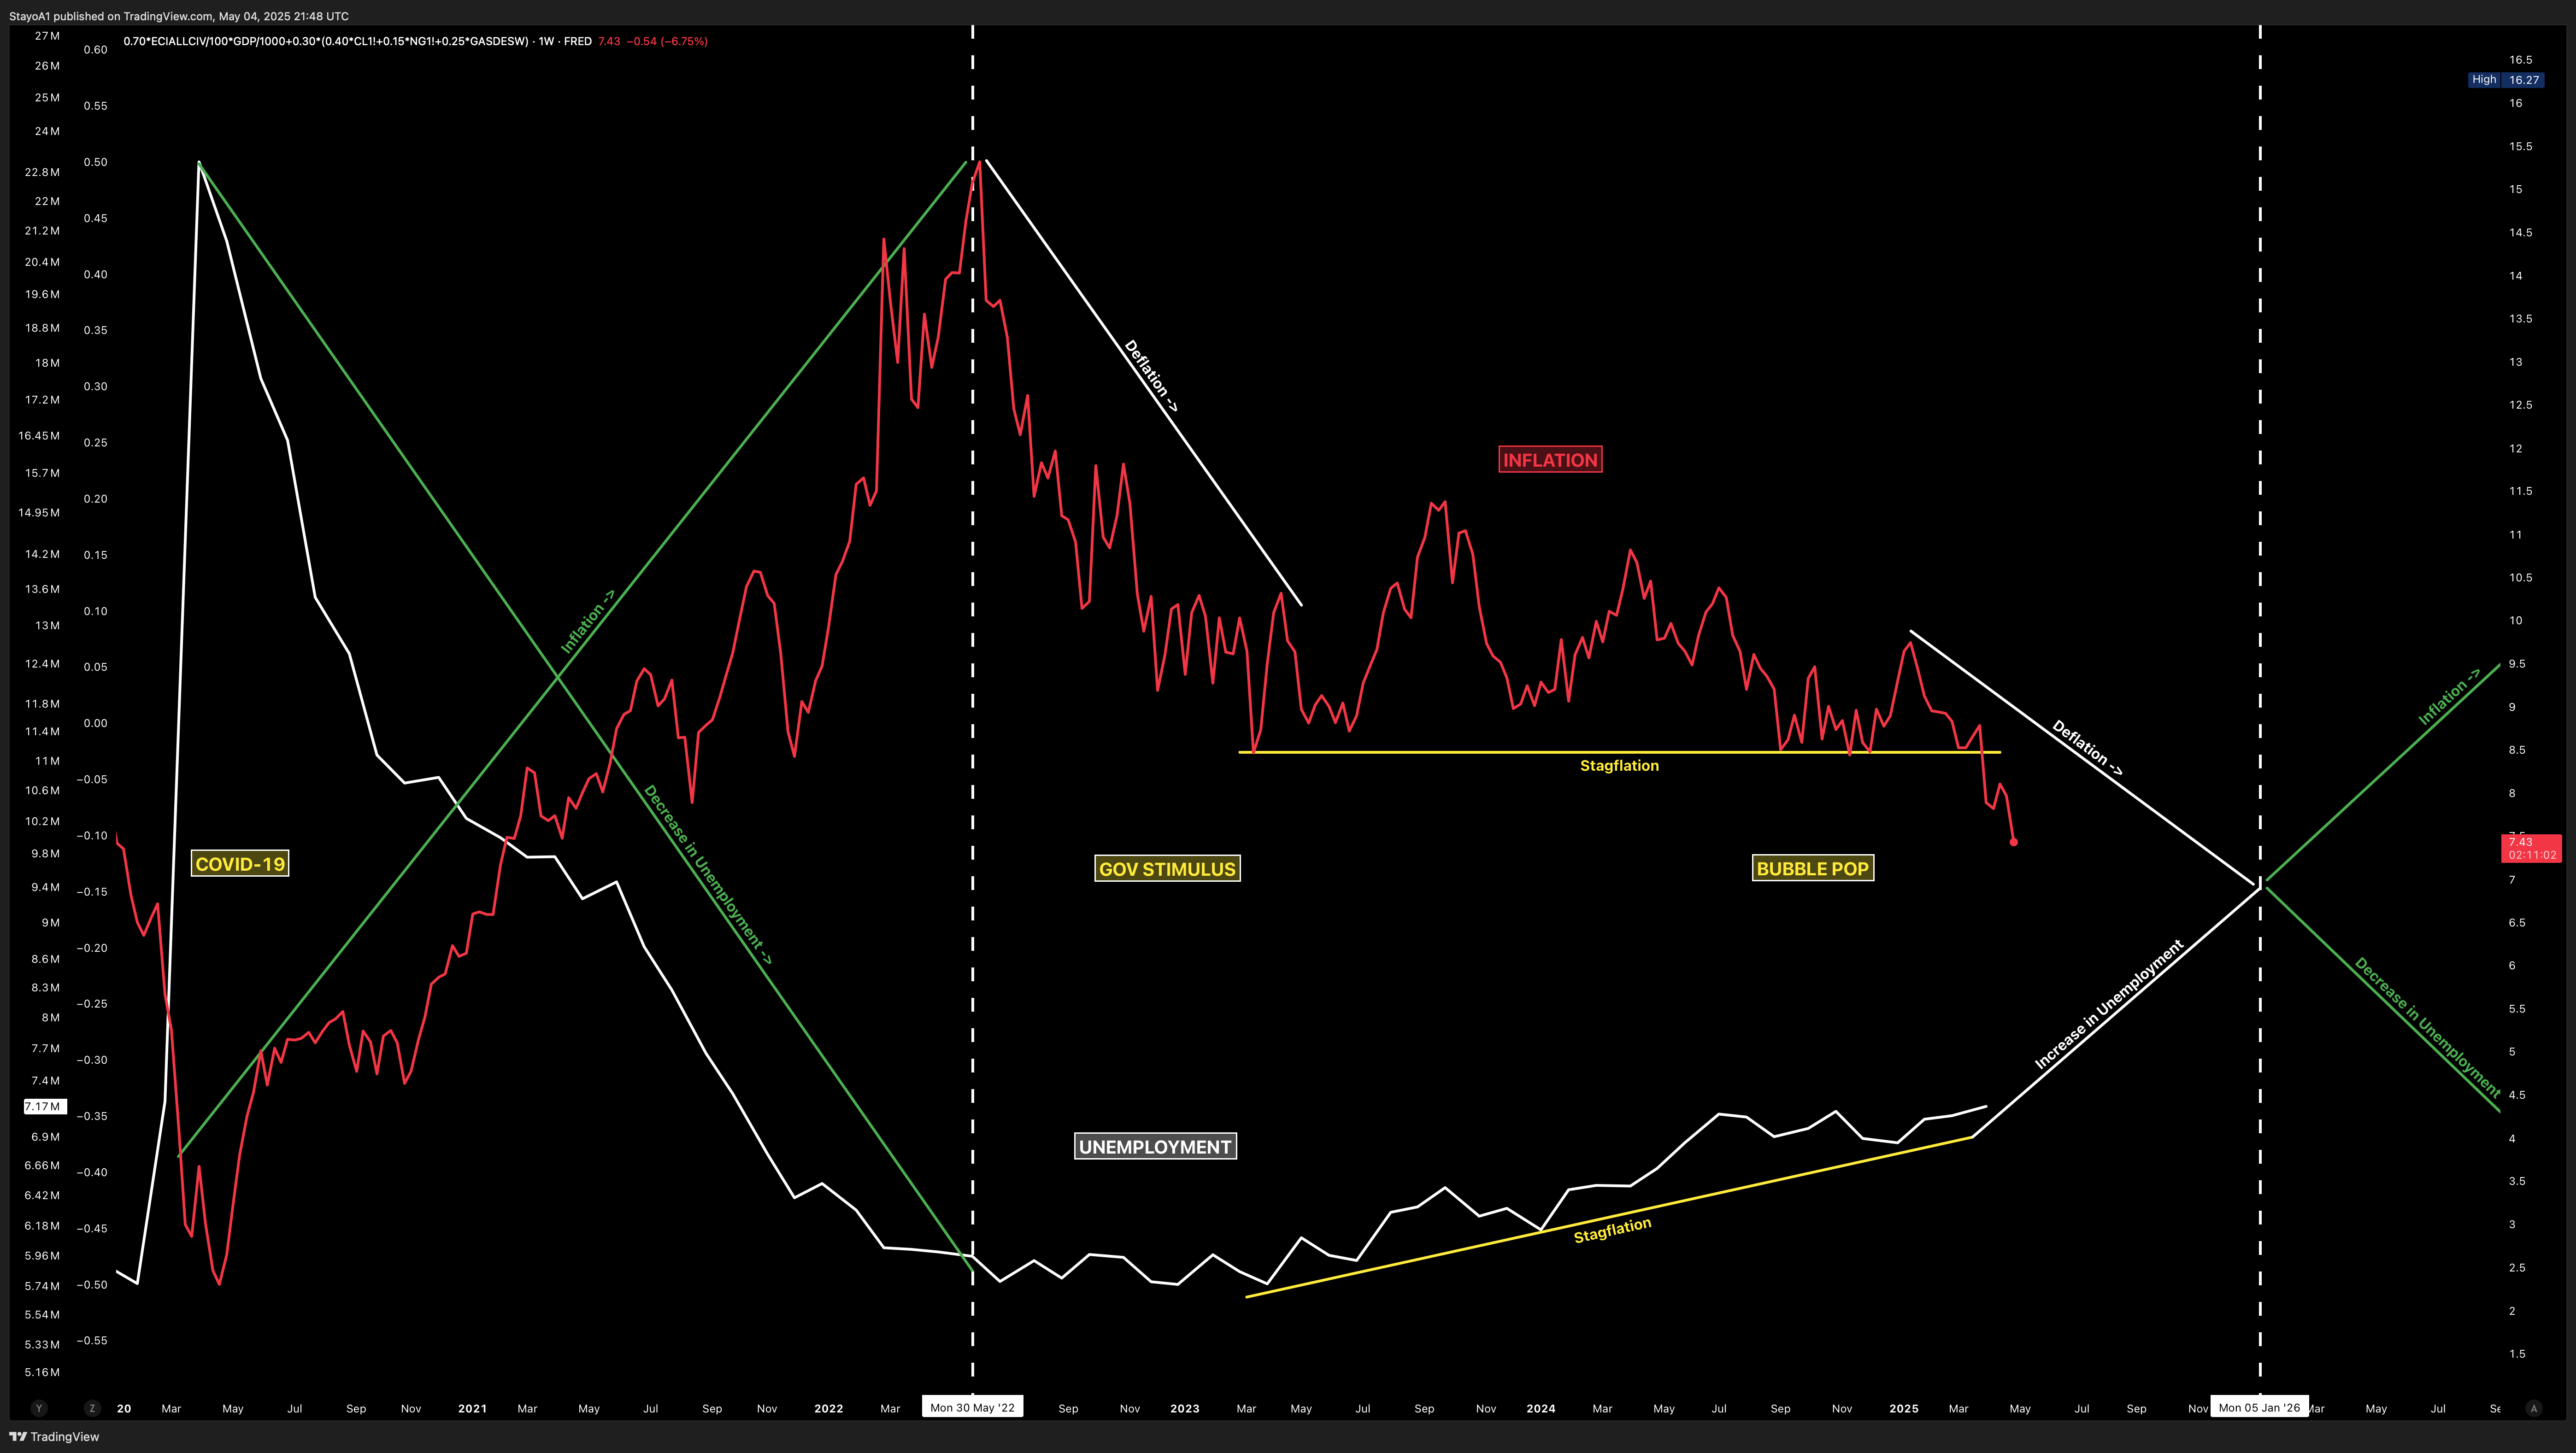
Macro Context: We Are in the Deflationary Stage
Let’s be crystal clear:
We are no longer entering deflation.
We are in it.
This started officially on April 7, when I laid out the full cycle:
Deflation → Rate Cuts → Debt Refi → QE → Deregulation/Incentives → Reflation
That’s the roadmap. No guesswork. The Fed is already on track — the market just hasn’t fully priced it in yet.
And anyone still claiming we’re in “stagflation” is ignoring the data.
Inflation is rolling. Growth is softening. Earnings are fading.
This is not a bullish macro backdrop.
 Open original image in a new tab
New This Week: TLT Setup Is Live
There is a clear unfilled gap on $TLT at $87.
That gap is likely to fill this week. In a deflationary regime, TLT (long-dated Treasuries) becomes one of the best asymmetrical trades on the board.
This is your last window to position before rate cuts become reality. The bond market is leading. The equity market is lagging. Don’t sleep.
Market Breadth: Still Broken
Another key thesis I’ve hammered for weeks is breadth.
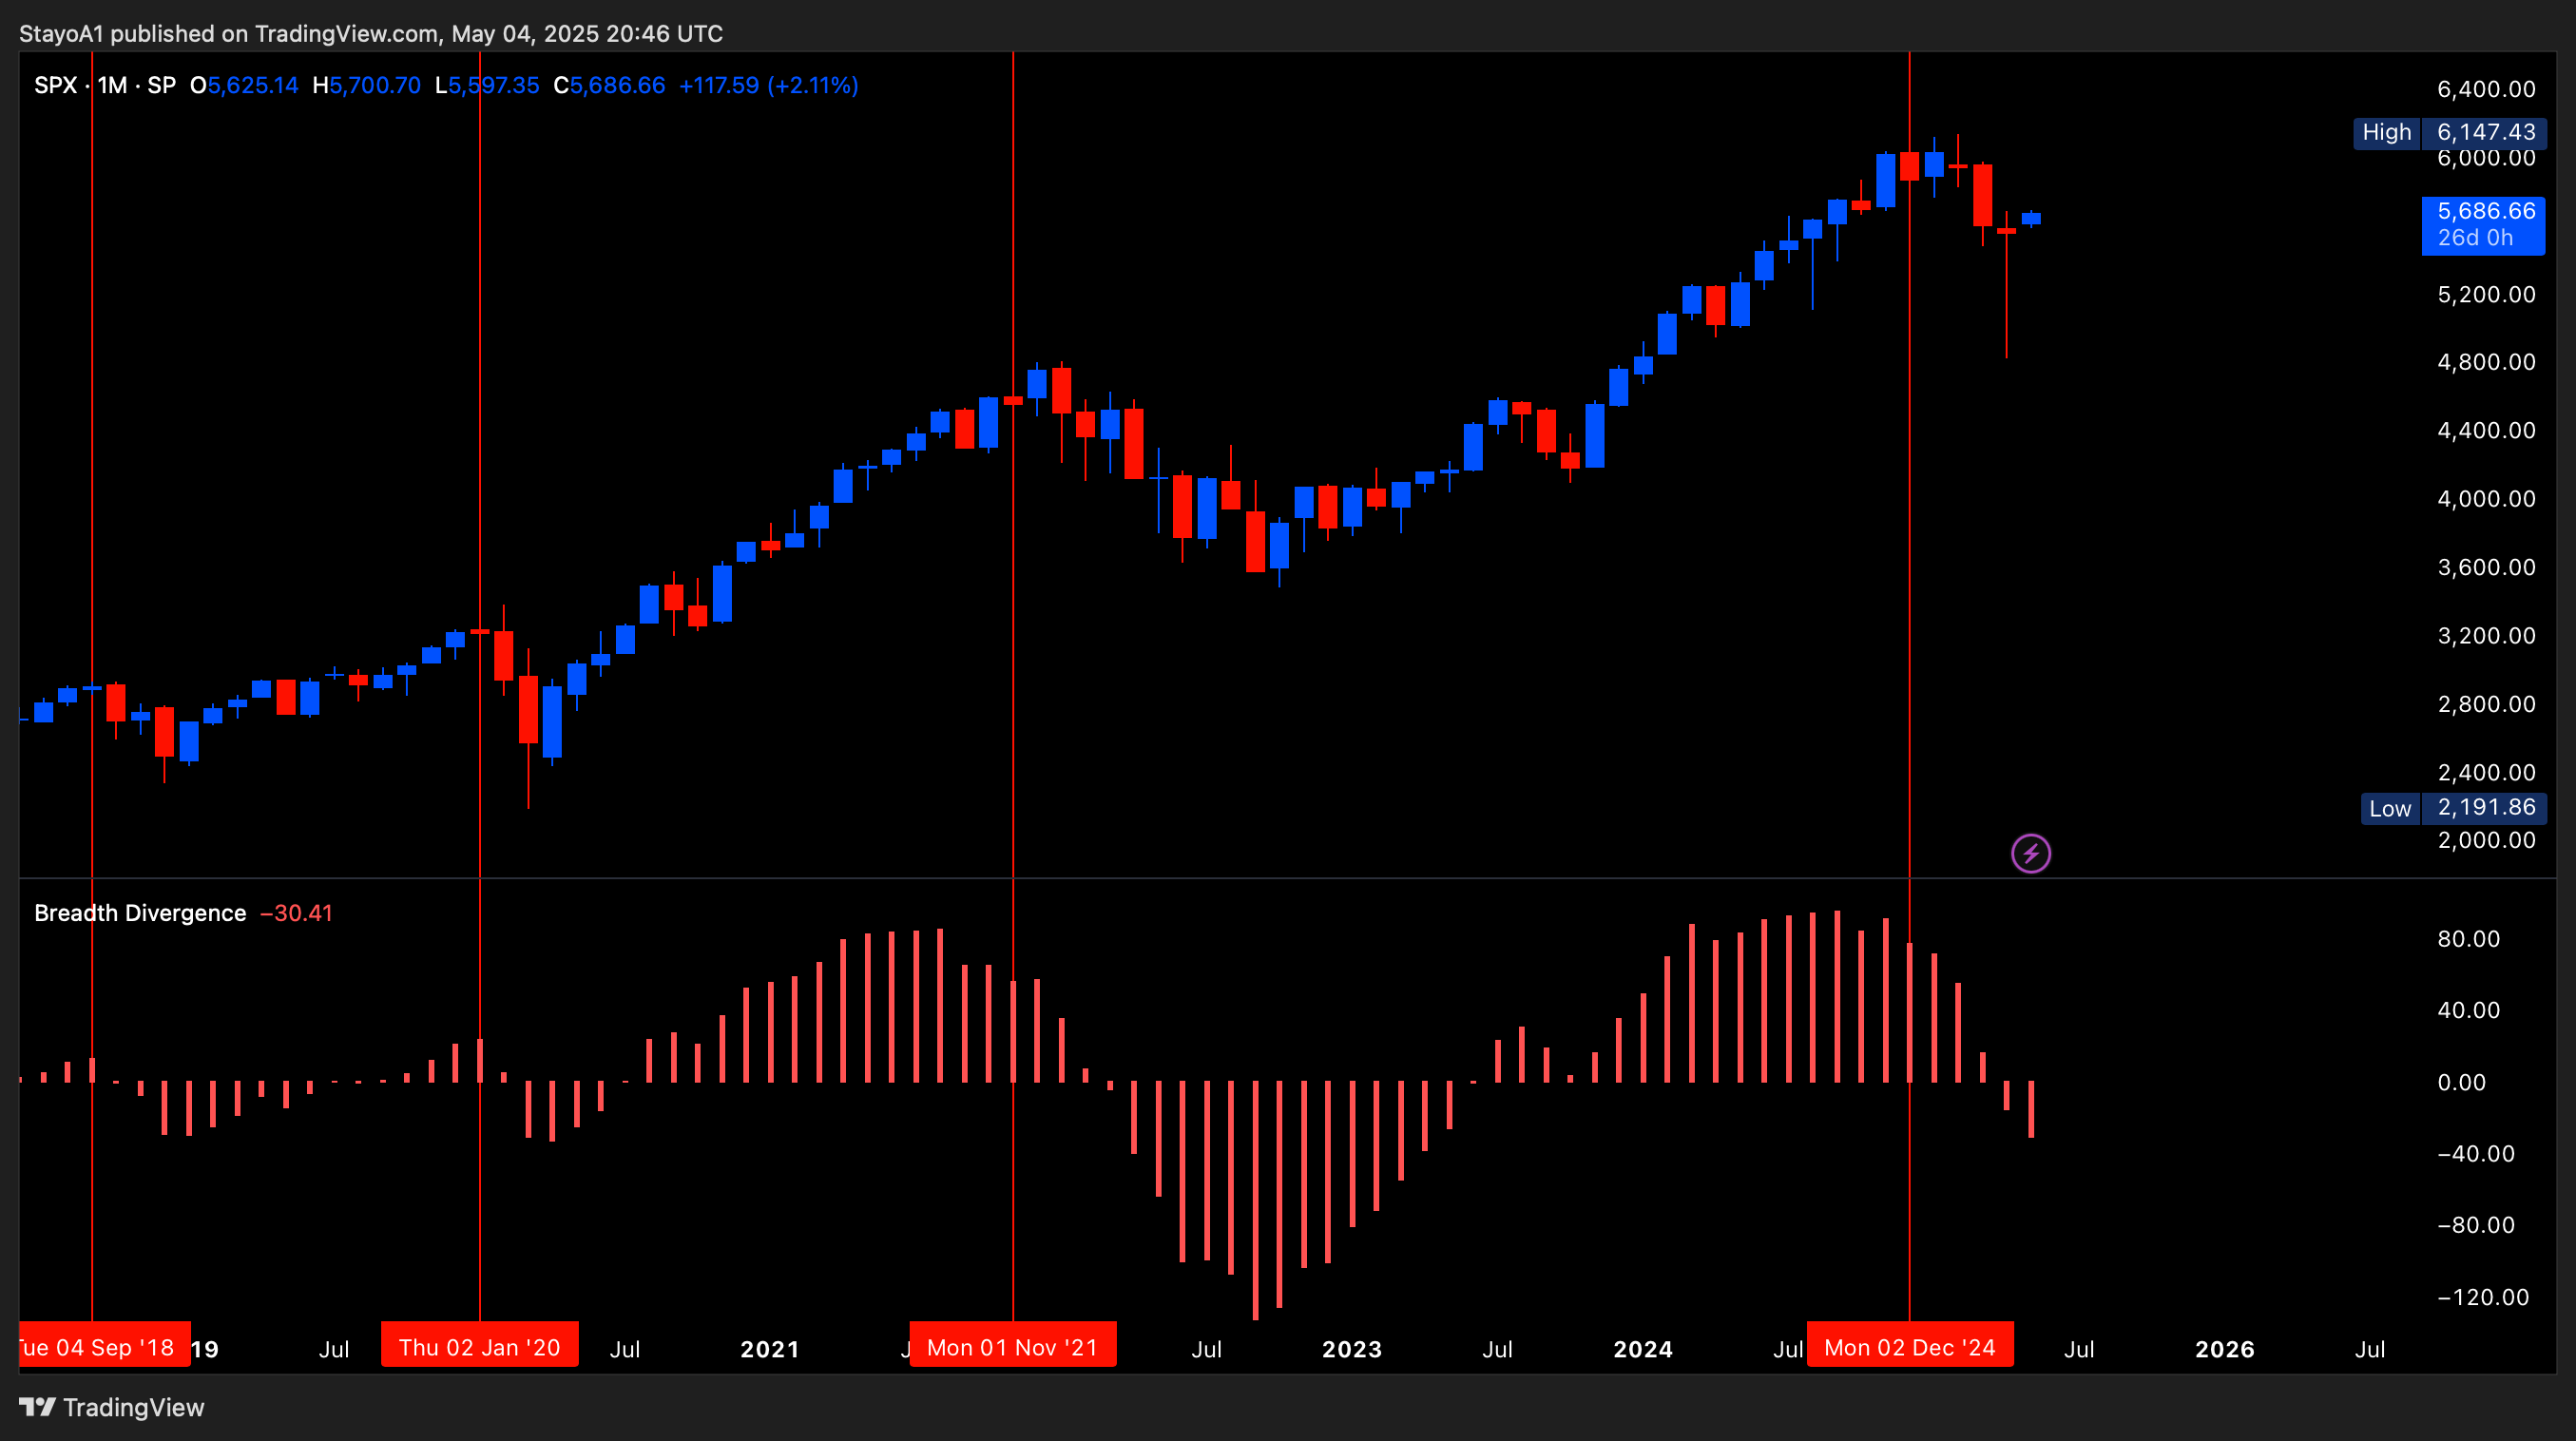
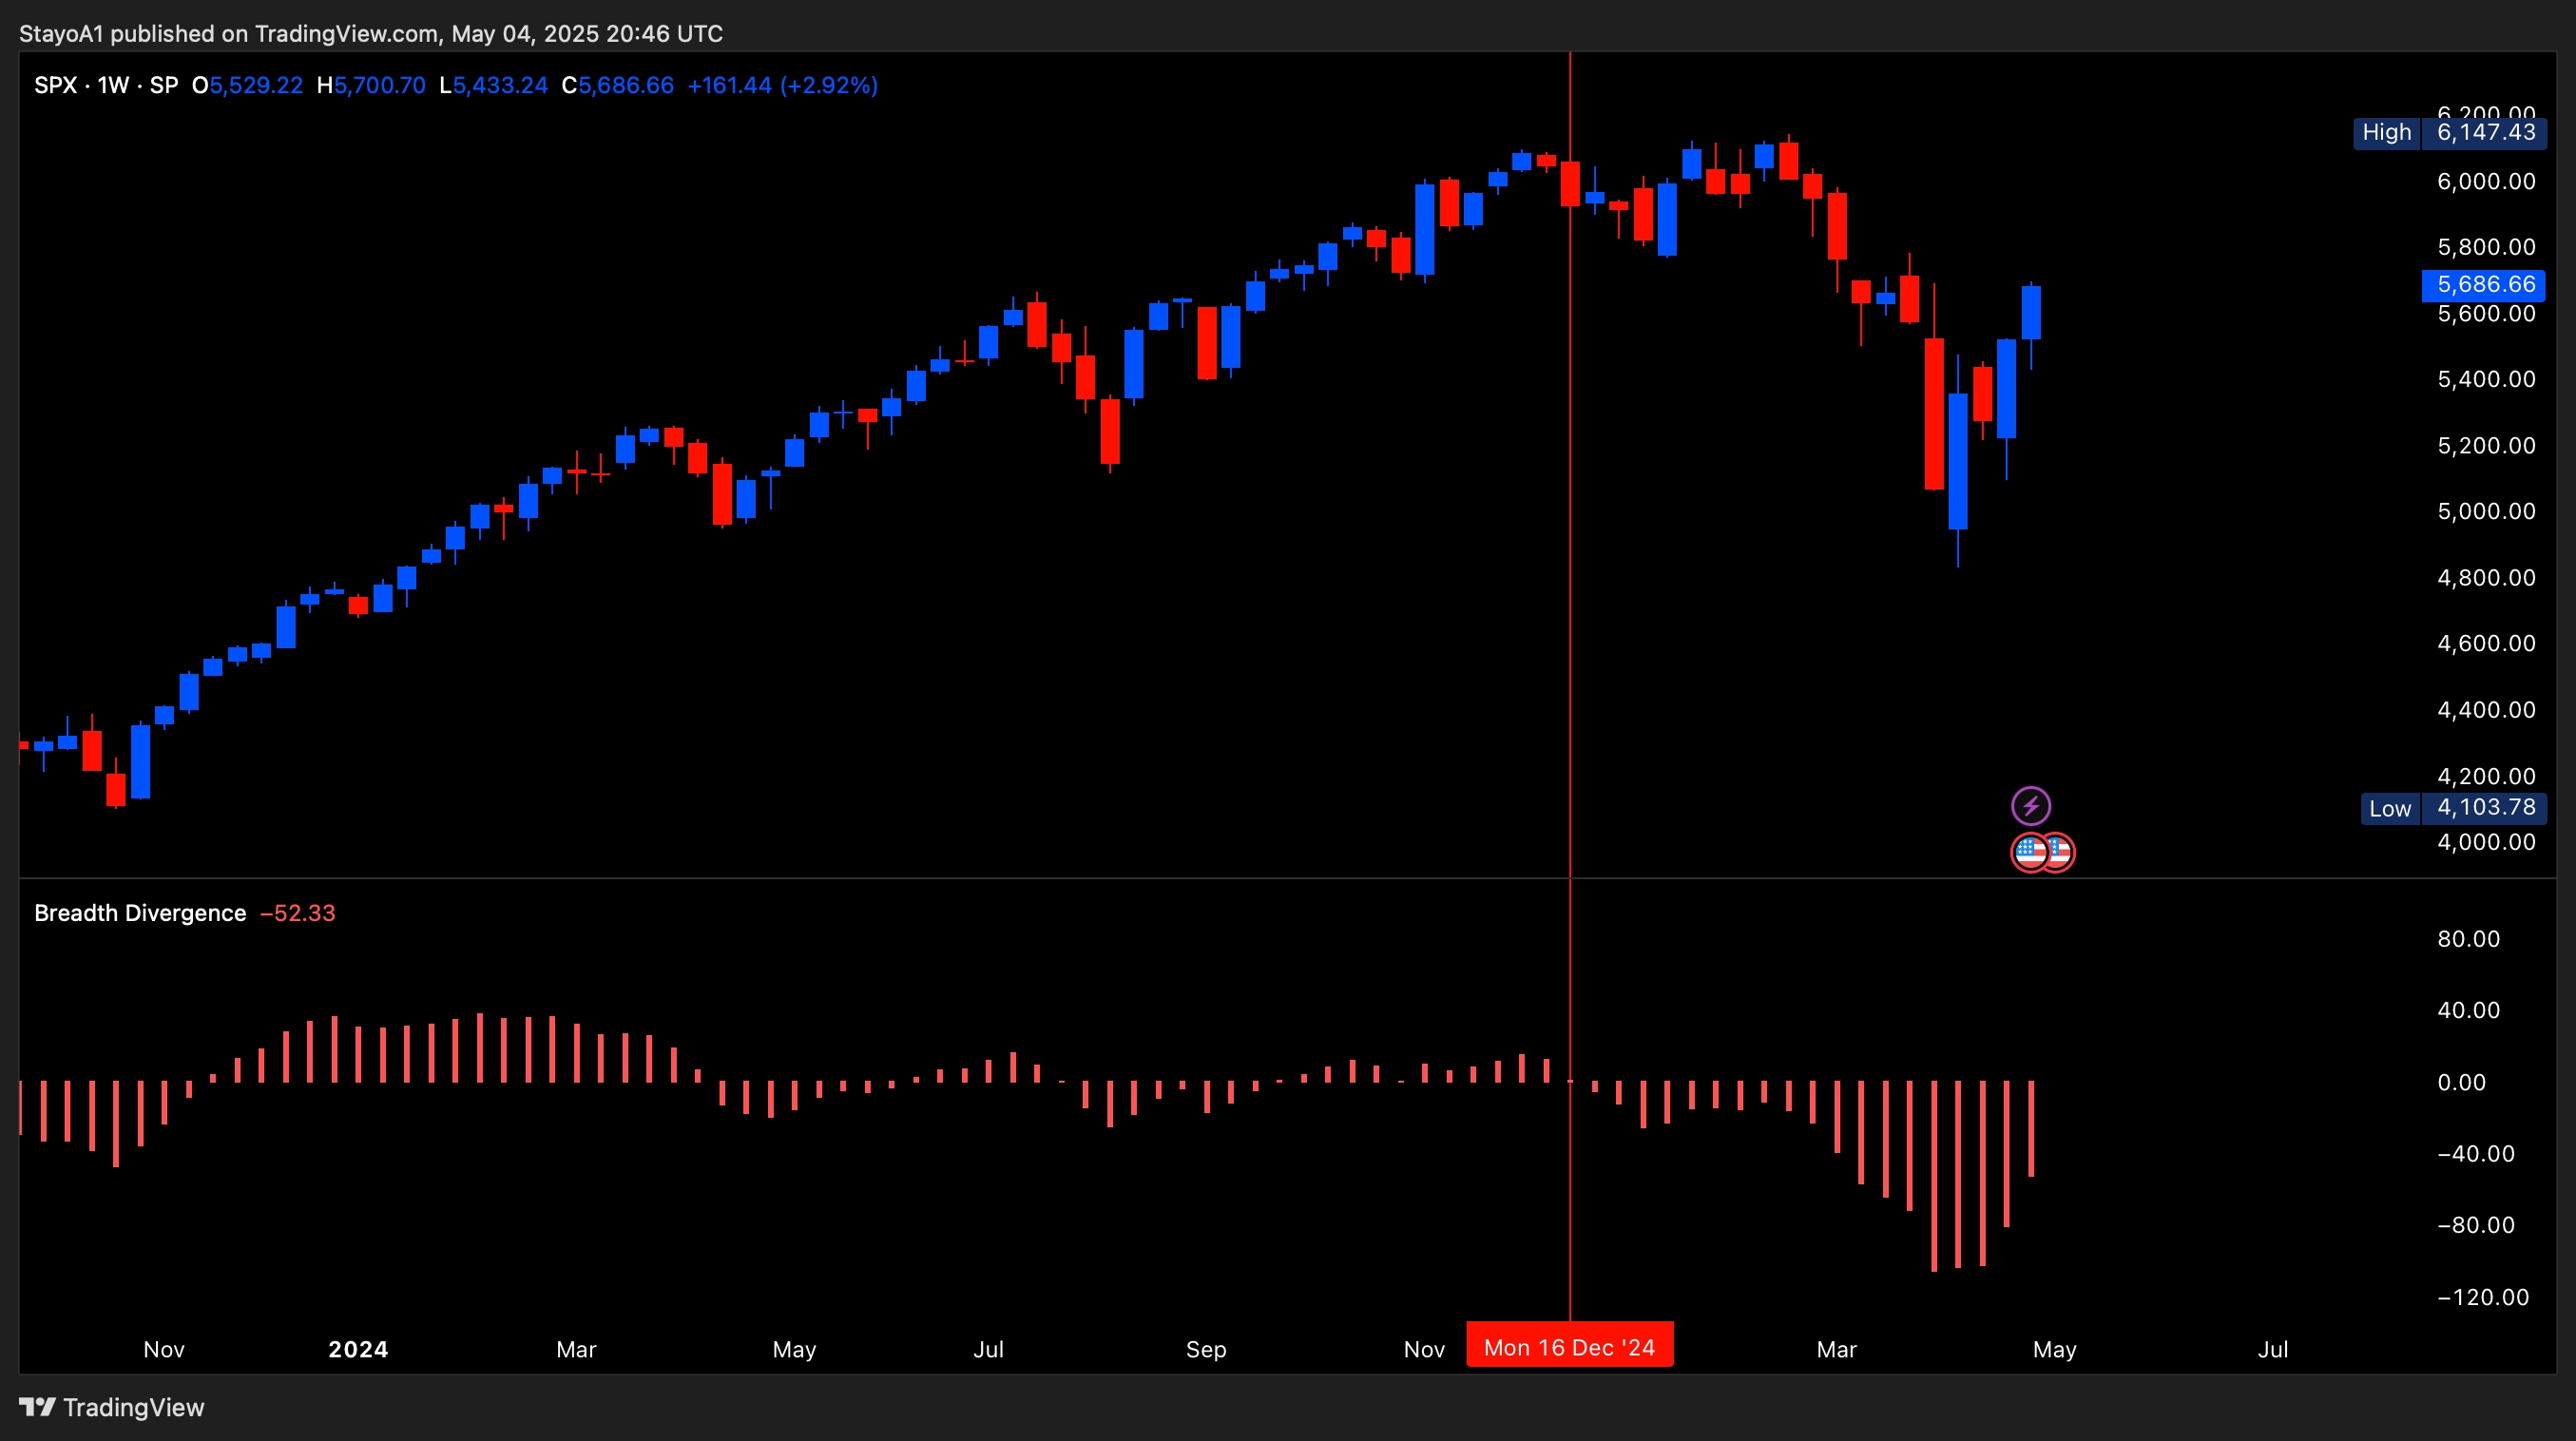
Despite price rising, breadth remains:
Negative on the monthly, and now even weaker than April.
Negative on the weekly, though not lower than last week.
This is not confirmation of strength. This is a rolling top.
What we’re seeing is index-level complacency masking under-the-hood weakness. That’s textbook trap behavior.
 Open original image in a new tab
 Open original image in a new tab
The Psychology of a Complacency Wave
Back in my April 21st article, I said:
“But before the true pain begins, markets need to deliver a ‘complacency wave’ — a period where most participants believe the worst is over.
It’s a psychological setup. Everyone needs to think the bull market is back before it breaks. That’s how liquidity is harvested and capital is trapped.”
Then on April 28th, I followed up with confirmation: the wave had begun.
Now, one week later, I’m showing you what the peak looks like — and what comes next.
Let’s take a quick look at the behavioral patterns that always show up during this phase, and why the current backdrop fits it perfectly.
One of the clearest signs we’re in a complacency wave is how disconnected behavior becomes from reality. This isn’t about earnings, inflation, or the Fed anymore — it’s about emotion. When retail crowds rush in while smart money stands aside, the trap is almost always being set.
Here’s how it works:
Fear turns to FOMO.
The bottom feels “obvious” in hindsight.
Every dip gets bought faster than the last.
Social media explodes with celebratory charts.
Narrative flip.
Recession fears “cool,” headlines become euphoric.
Tariffs? Inflation? War? “Doesn’t matter, we’re going up.”
Reality takes a backseat to momentum.
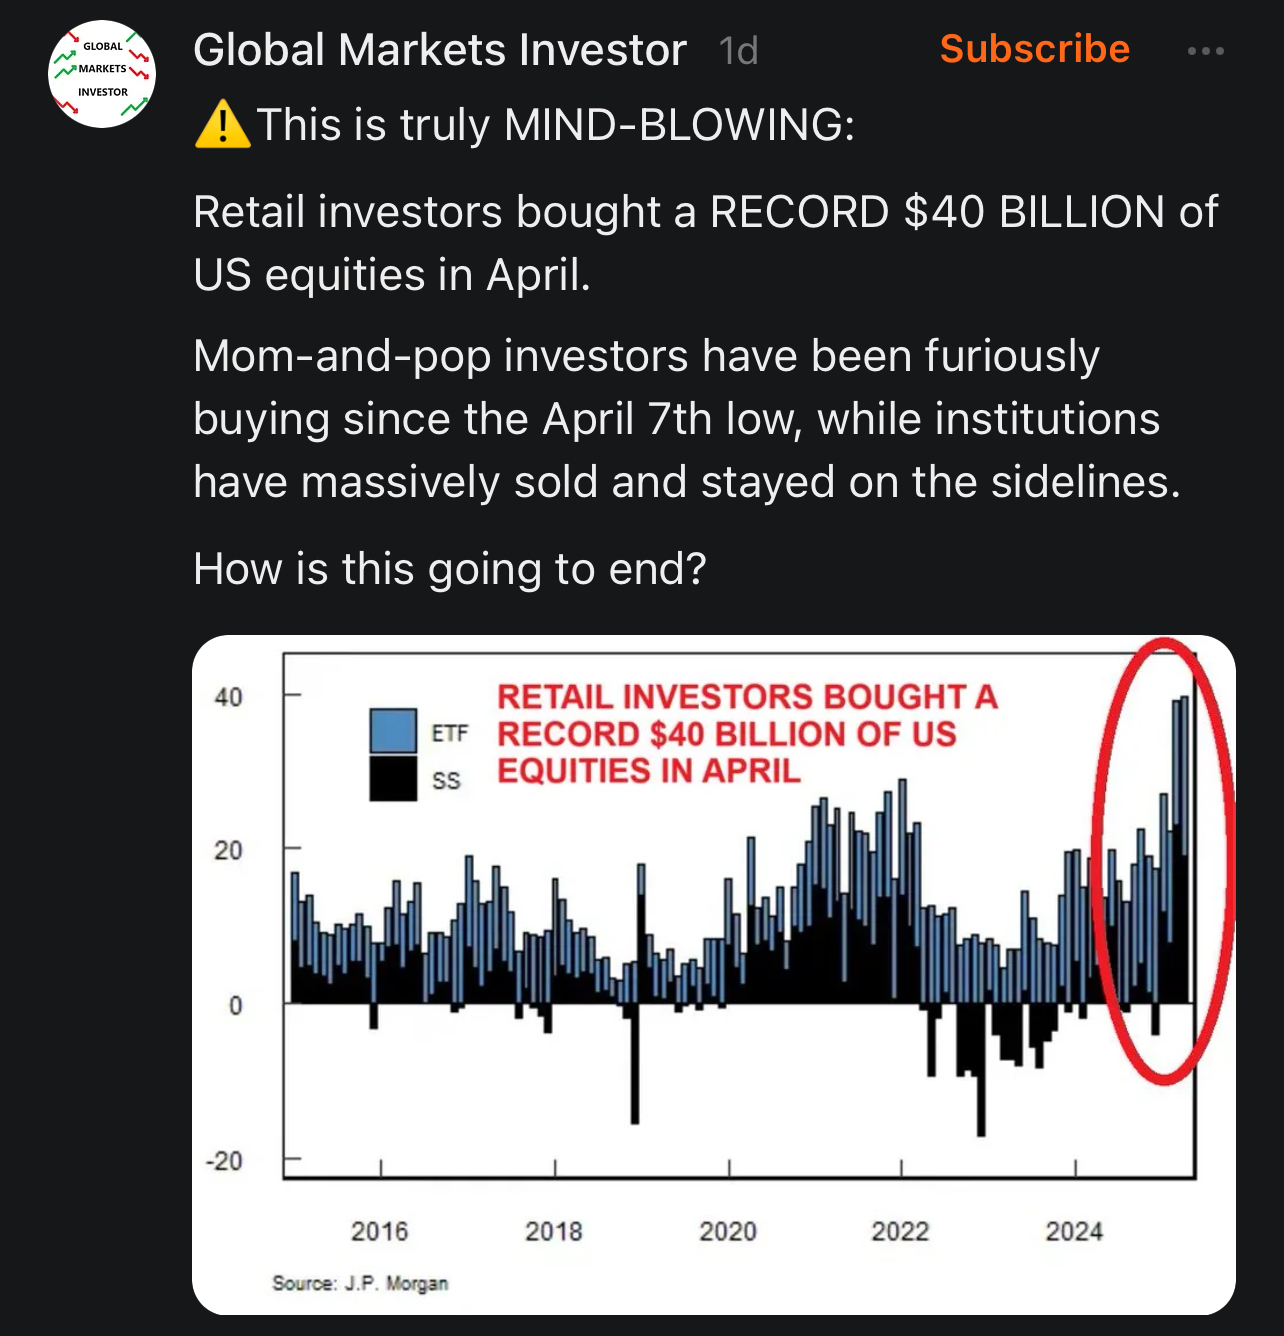
Retail piles in at the top.
$40B in retail inflows in April (see chart below).
The biggest buying spree since records began.
Institutional money? Nowhere to be found.
 Open original image in a new tab
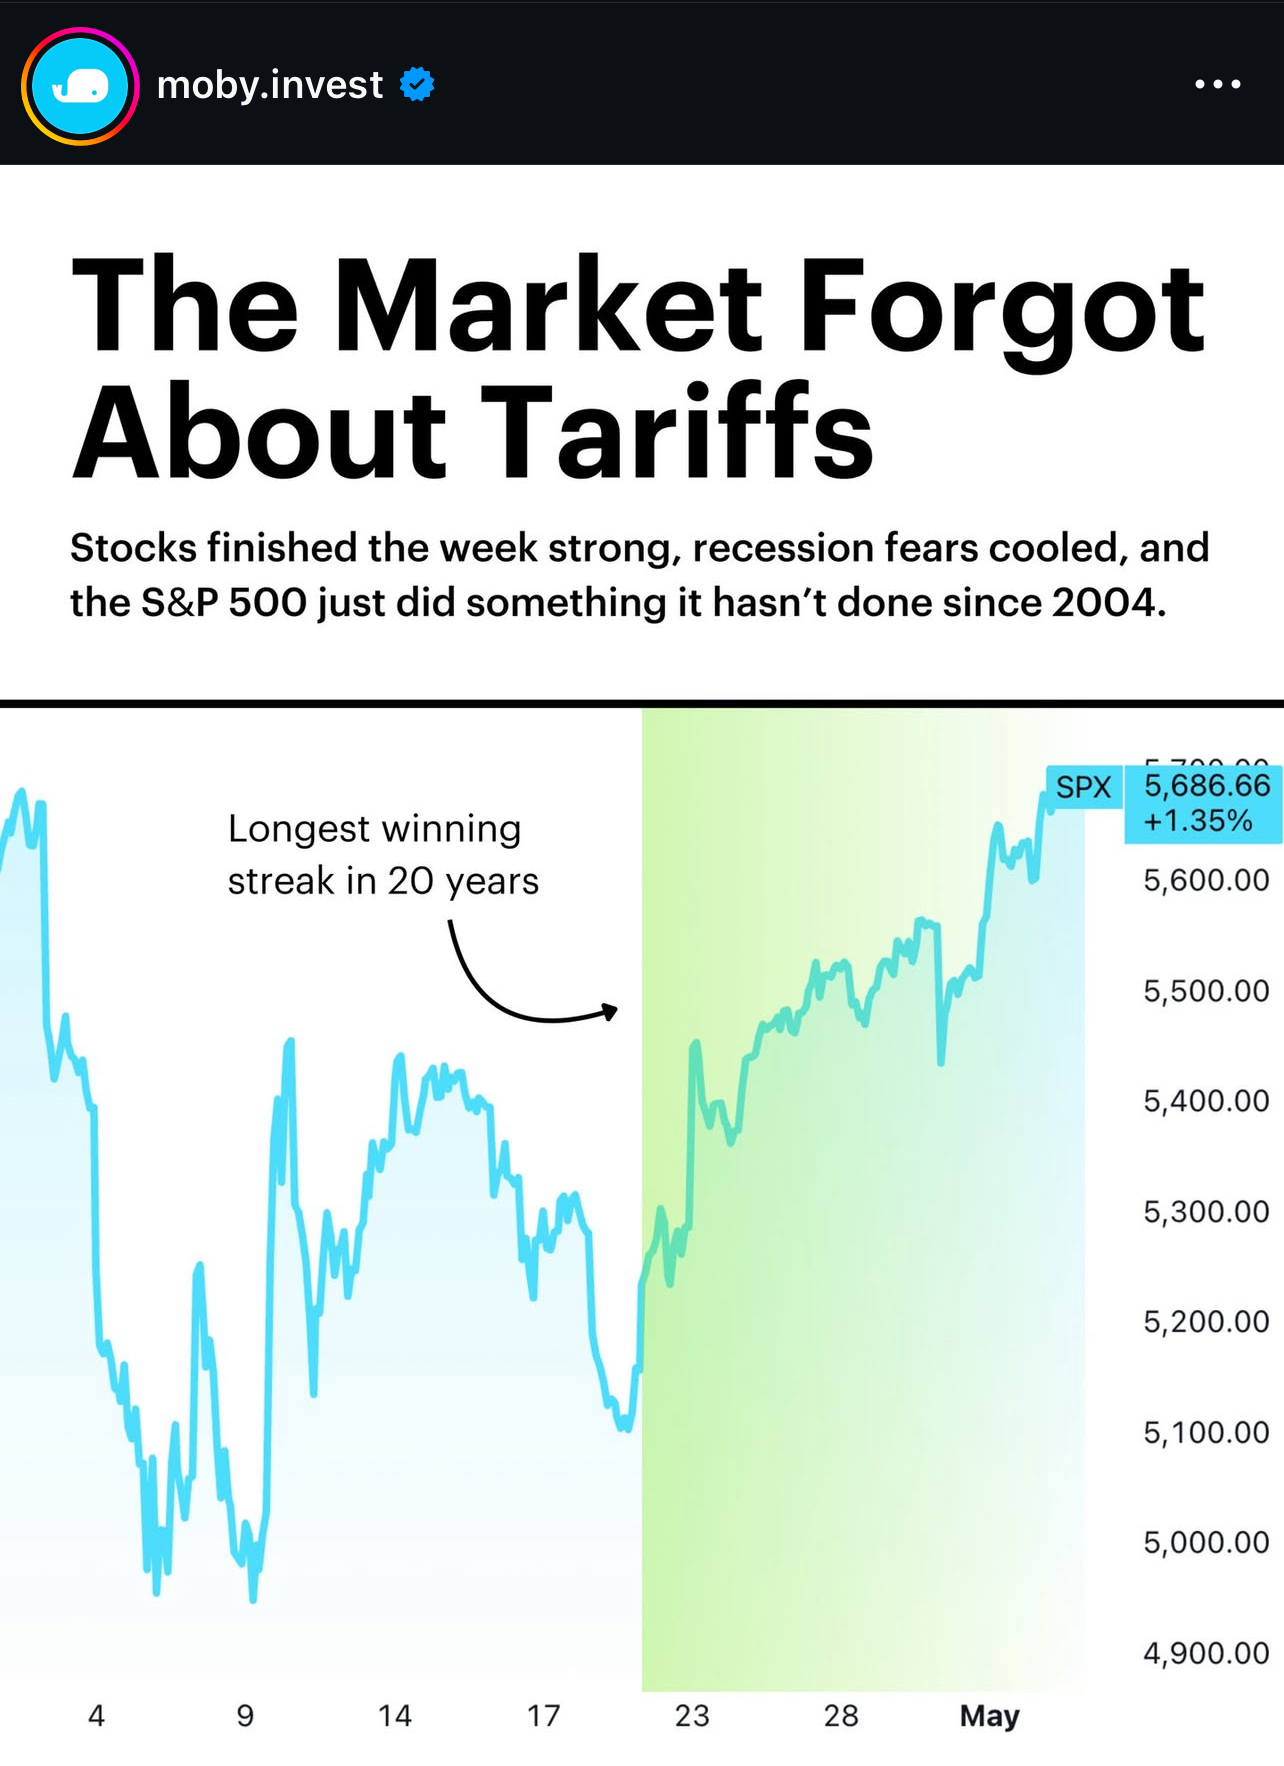
Winning streaks blind logic.
The S&P just posted the longest winning streak in 20 years.
Media celebrates as if that’s a bullish signal — but historically, it’s the final burst before a reversal.
 Open original image in a new tab
These are the psychological breadcrumbs of a complacency wave.
And now you know how to recognize them.
When the crowd gets loud, the setup is almost over.
Price Structure and Levels to Watch
Here’s the map:
5700–5800: This is current resistance. We're here now.
March 25th high (~5800): A fakeout above here would trigger algos and CTAs.
5920: This is the line in the sand. Break above that, and I’ll revisit the thesis. But until then? The trap is alive.
May 19th: The date when the new market structure officially begins.
That’s the week where OPEX clears, and positioning shifts. That’s when I expect the real move to show its hand.
Open original image in a new tabVIX Says It’s Time to Hedge Again
In the last post, I said:
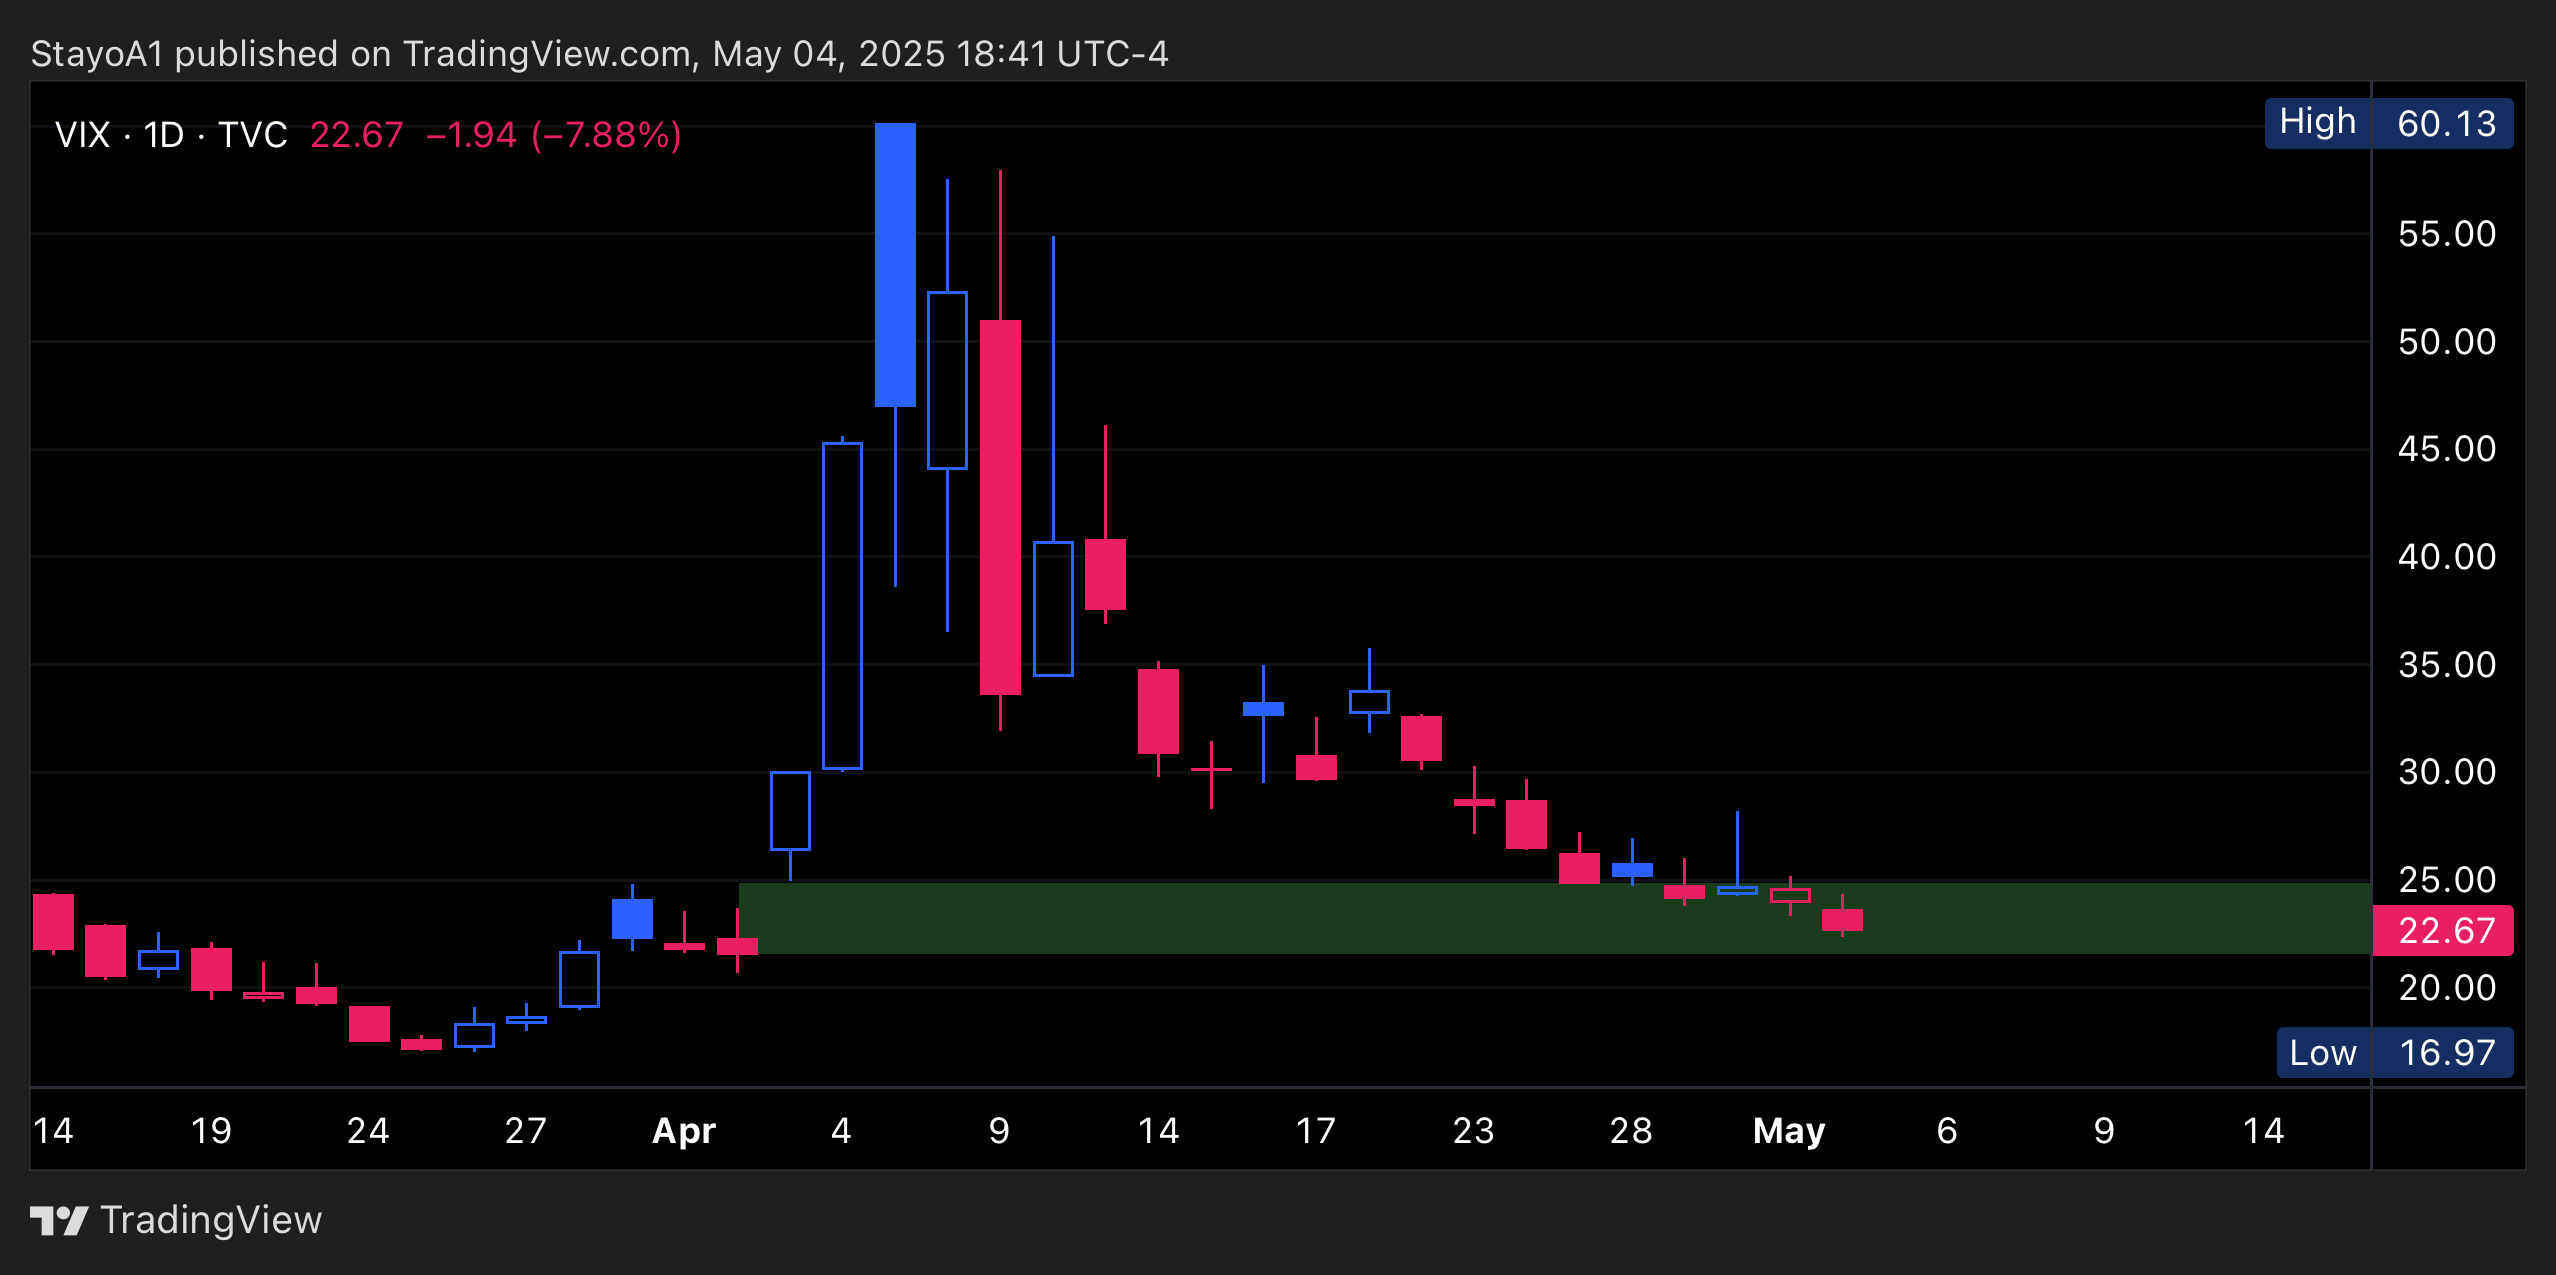
“We need a VIX below 23 for the complacency leg to extend.”
We got that. VIX hit 22.50, and we’re still there.
Now we’re in the zone where:
Put protection is cheap
Volatility is compressed
Risk/reward tilts toward downside
We might still see VIX hit 21.50, but below that — you’re fighting reality.
Could the VIX break under $20? Sure. But if it does, and you don’t believe in the macro story, then you’re not trading, you’re dreaming. Because if VIX goes under $20, you’ll see everyone calling the start of a new bull market — right before the rug gets pulled.
 Open original image in a new tab
What To Do Right Now
Let me keep this simple.
Take profits. We’ve rallied roughly 1000 points off the lows. Don’t get greedy.
Scale into puts. Pricing is favorable again.
Load into TLT. The deflation + rate cut combo is coming.
Watch May 19th. That’s the market structure shift. Prepare now.
This is the tail end of the fakeout. Most won’t see it until it’s too late.
You’ve been warned — again.
If you want to be early, not loud, then be prepared.
The data is already telling you what comes next.
– Stelios
TL;DR – What You Need to Know
I called the complacency wave on April 21 at 5100 — we’re now at 5700.
The rally is driven by retail chasing, while institutions have stayed out.
Breadth is negative, macro is deteriorating, and sentiment is euphoric.
Unless $SPX breaks 5920, this is still a trap, not a breakout.
May 19th marks the start of the new market structure post-OPEX.
Action plan: Take profit, buy protection, scale into $TLT.
The setup is obvious. Most won’t act. You still can.