From the archive · Substack
Market Pulse: The Rally is Here…But Is It Real?
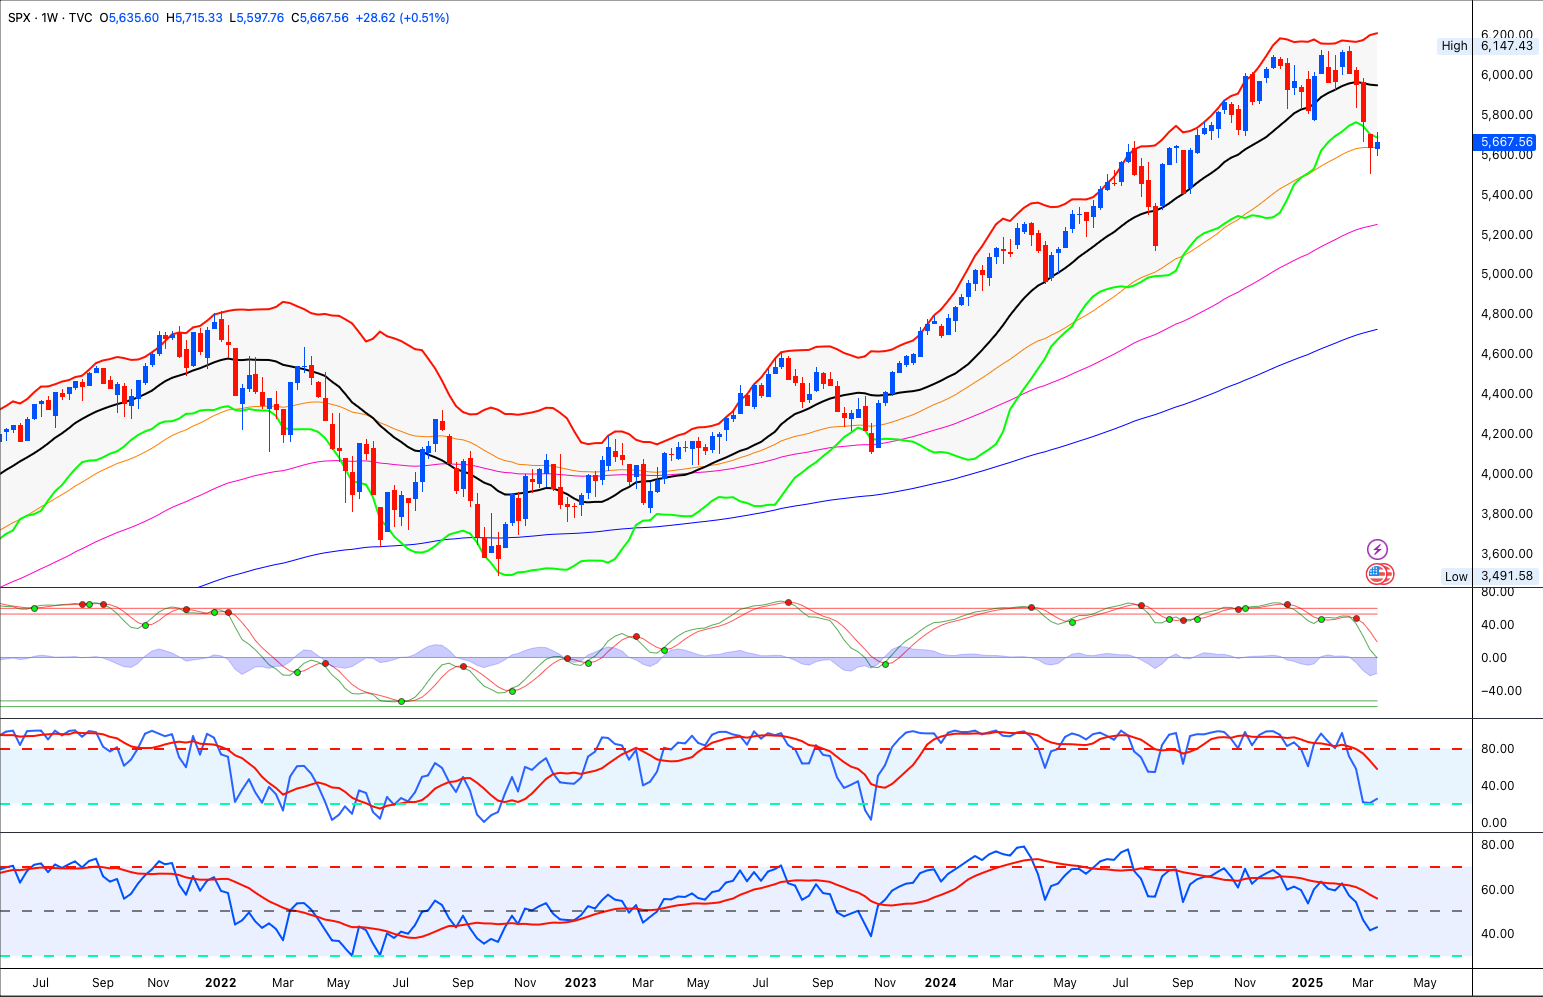
Last Week: A Bounce After the Storm
Last week finally gave us a green candle after enduring a month-long storm—four consecutive down weeks. With this week's upward tick, investors are left wondering: are we finally in the clear? Is it time to buy the dip, or are we witnessing just another fleeting bounce?
Let’s break it all down step-by-step.
 Open original image in a new tab
Alpha Alerts: Market Breadth Tells the Real Story
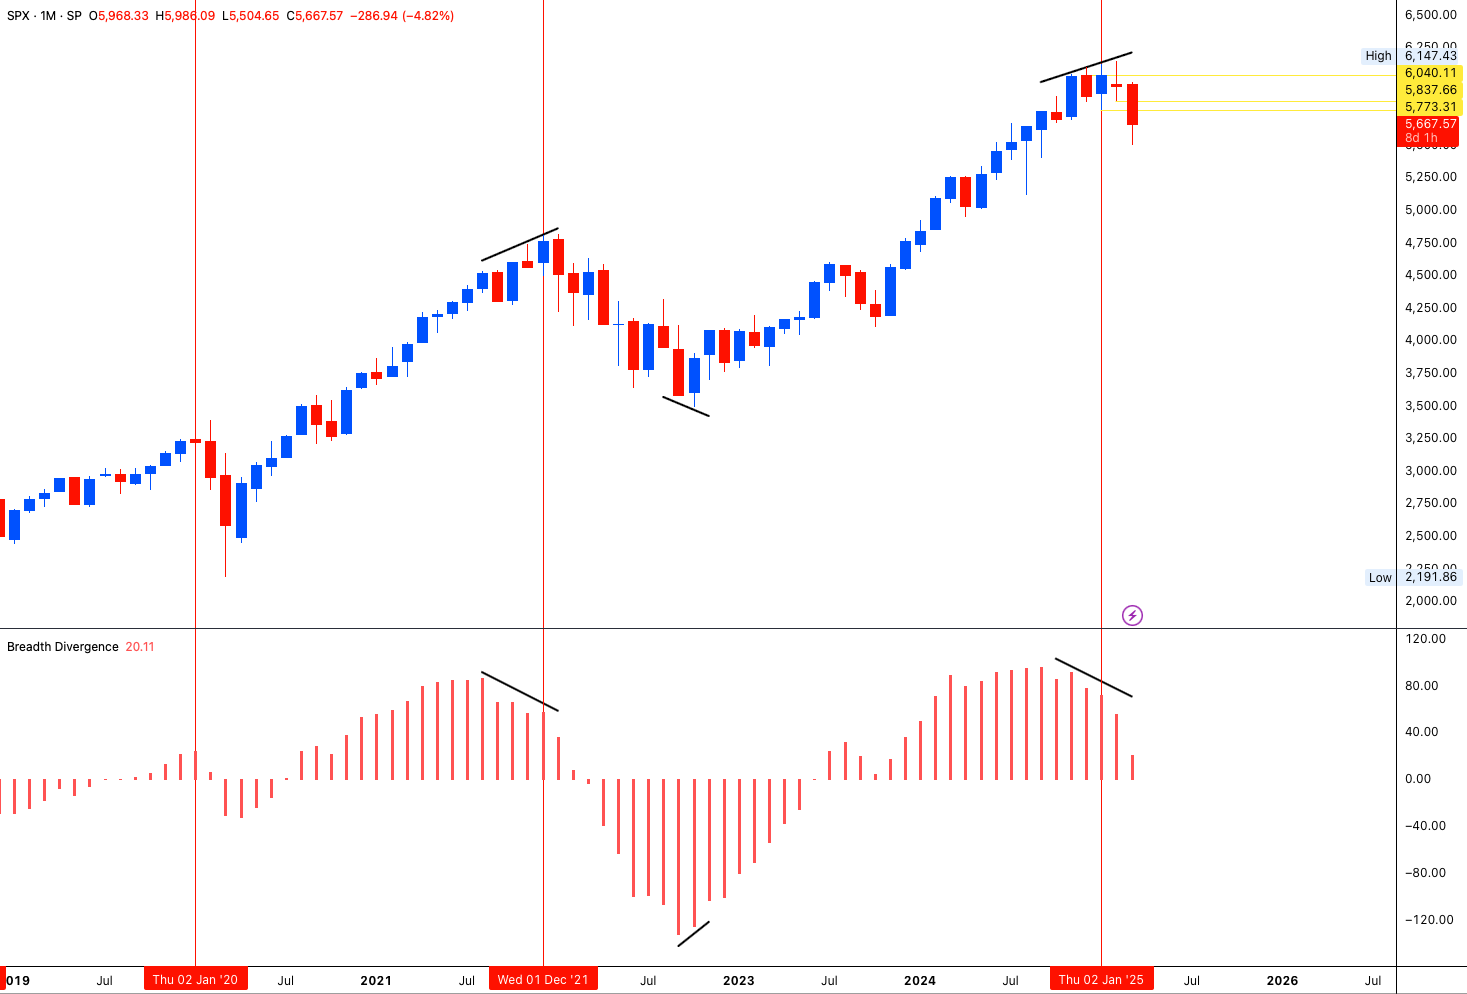
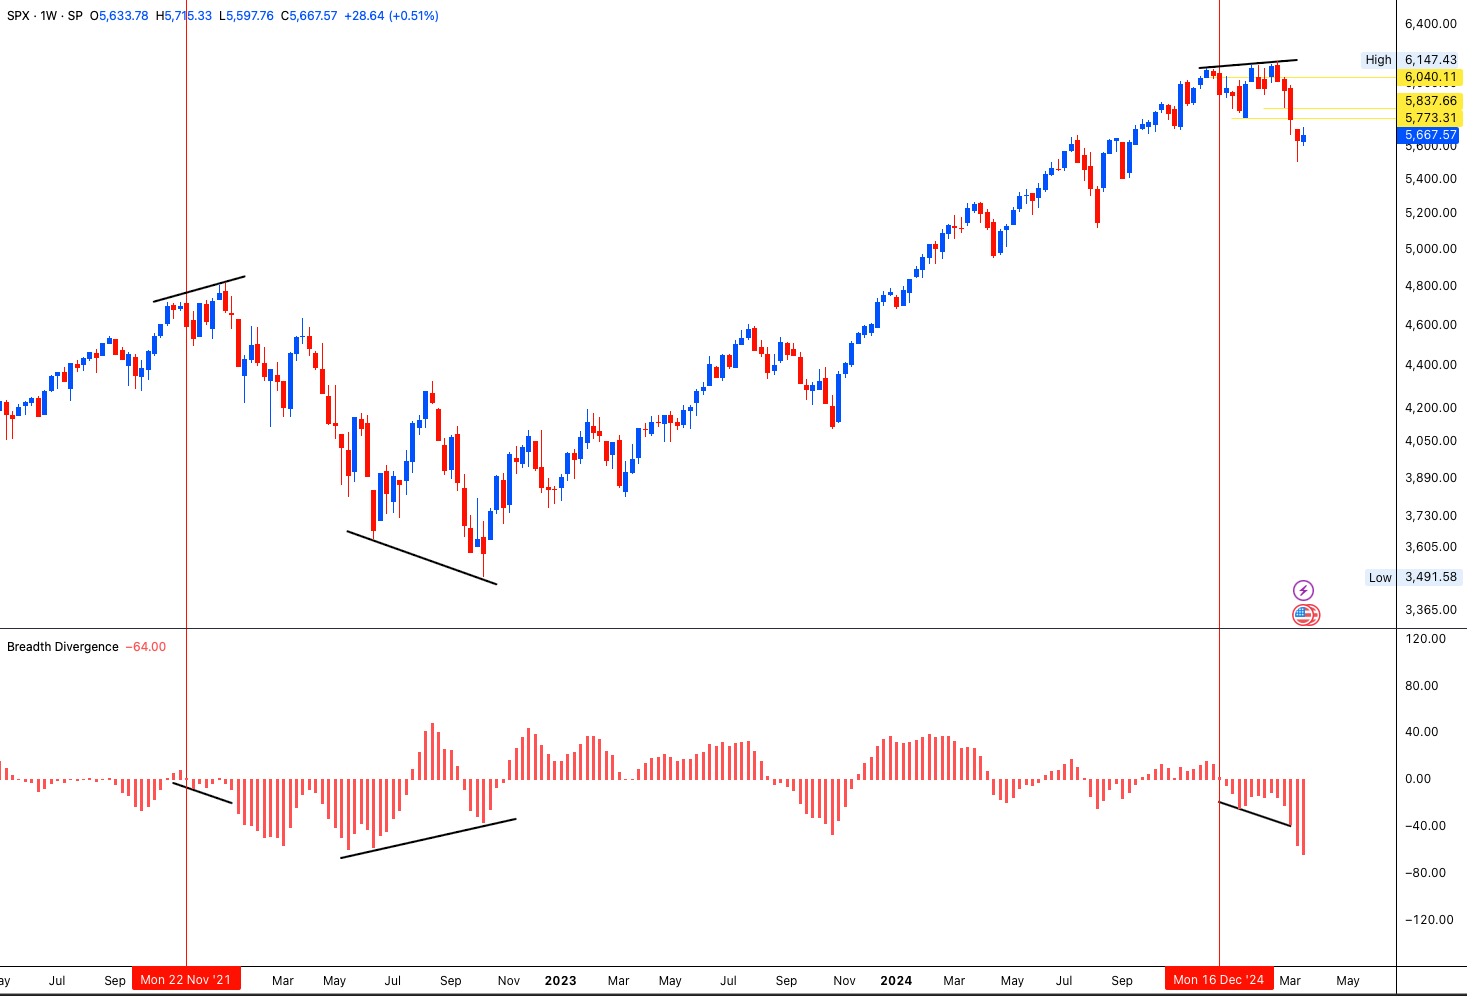
One crucial indicator I always consider is market breadth. While an index like the S&P 500 might be up, breadth measures how many of those underlying stocks are actually participating in the move upward.
January 2022 vs. January 2025: Both tops shared declining breadth characteristics. For instance, in August 2021 breadth peaked and started declining monthly even as the index climbed higher into January 2022. Similarly, breadth peaked in September 2024 at around 5,800 on the S&P, after which we saw a slight (~5%) move up to about 6,100, only to remain range-bound through November, December, January, and February—a classic distribution pattern.
 Open original image in a new tab
 Open original image in a new tab
Hustle & Flow: Key Levels & The Power of OPEX
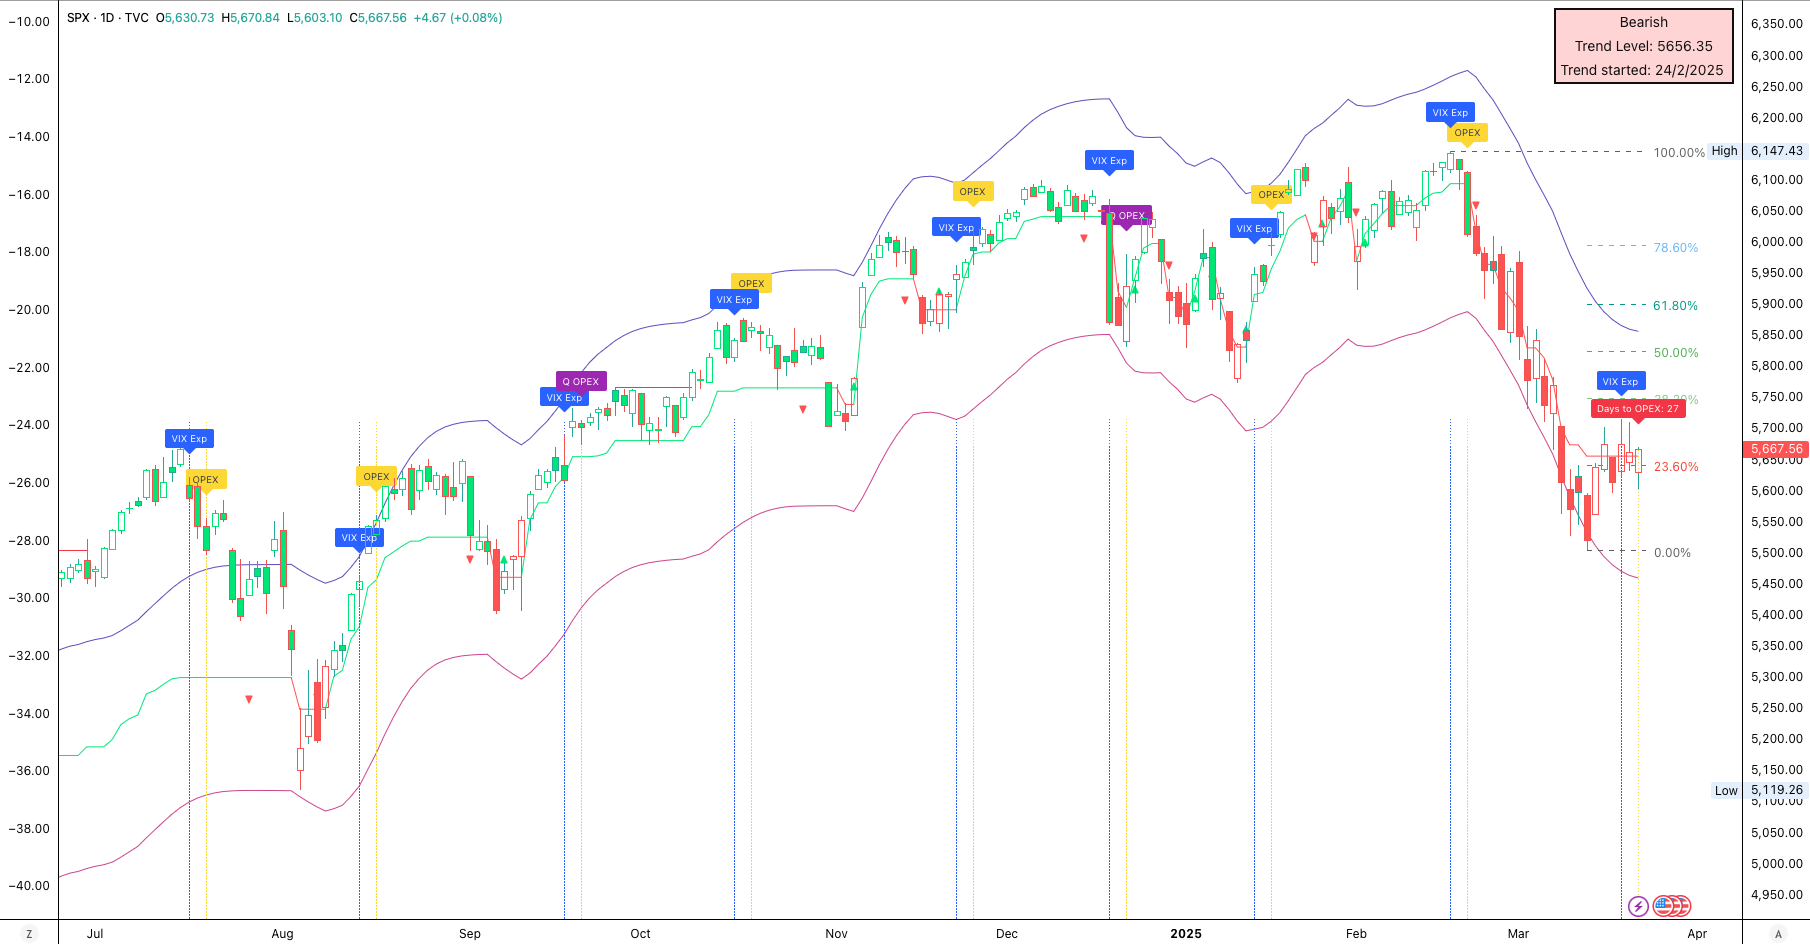
March’s critical task: regain and hold above 5,800 to maintain the uptrend into the April OPEX (options expiration) period, scheduled for April 17th.
Why is OPEX important?
Big banks and institutions sell derivatives on indices and stocks, creating structural boundaries that help prevent flash crashes or large, disorderly sell-offs. This forms a protective market range.
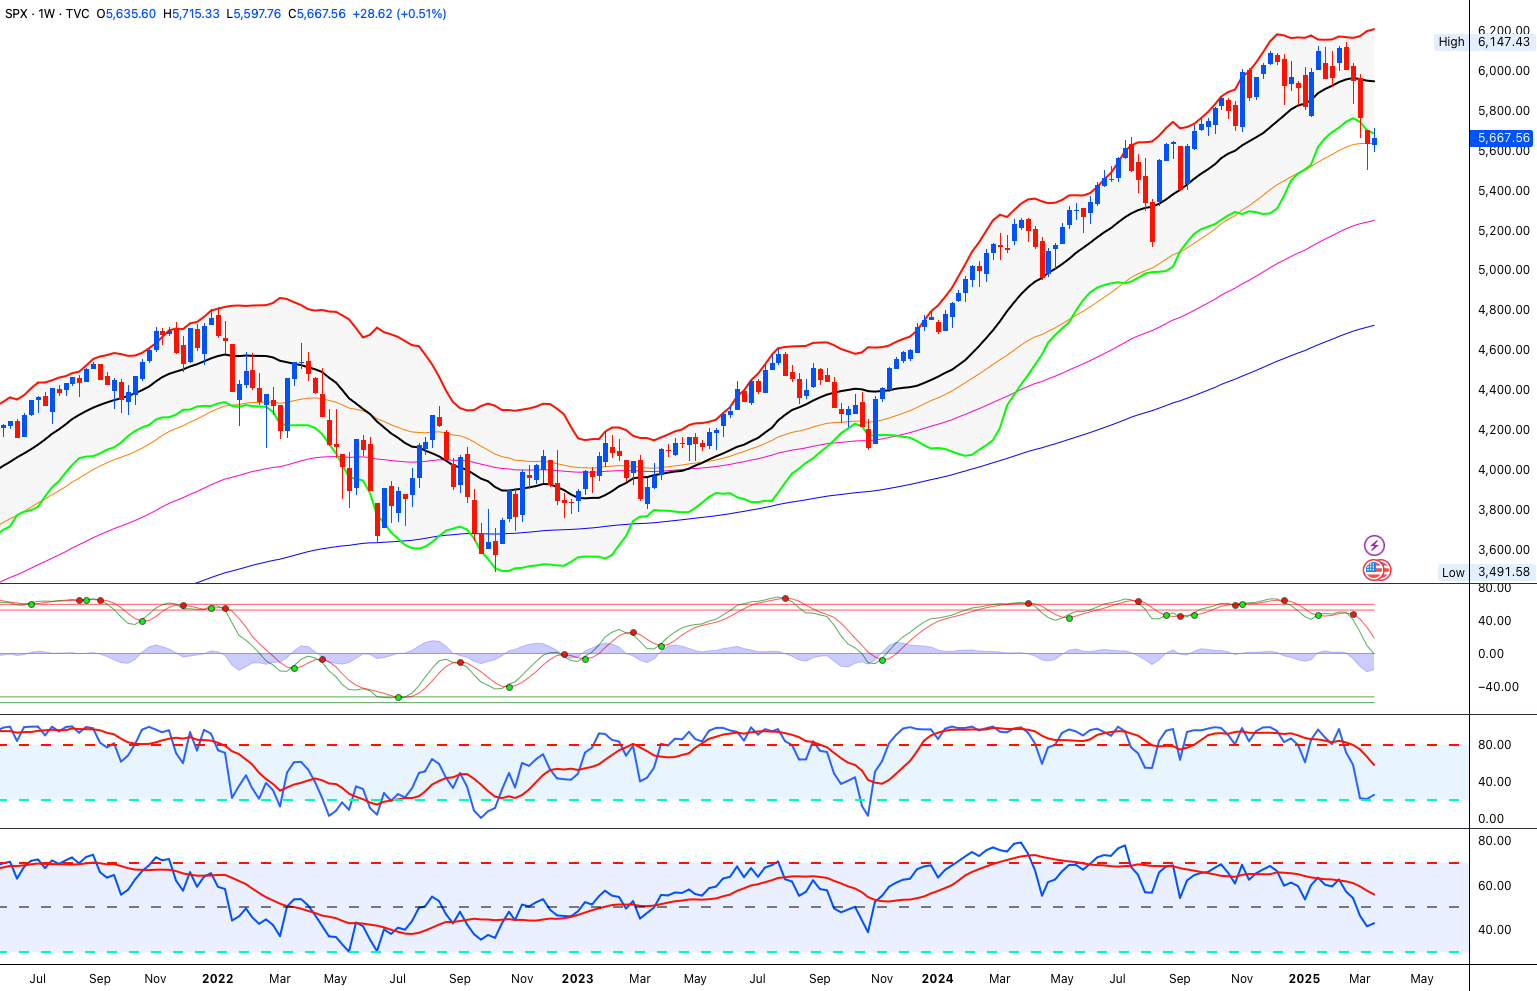
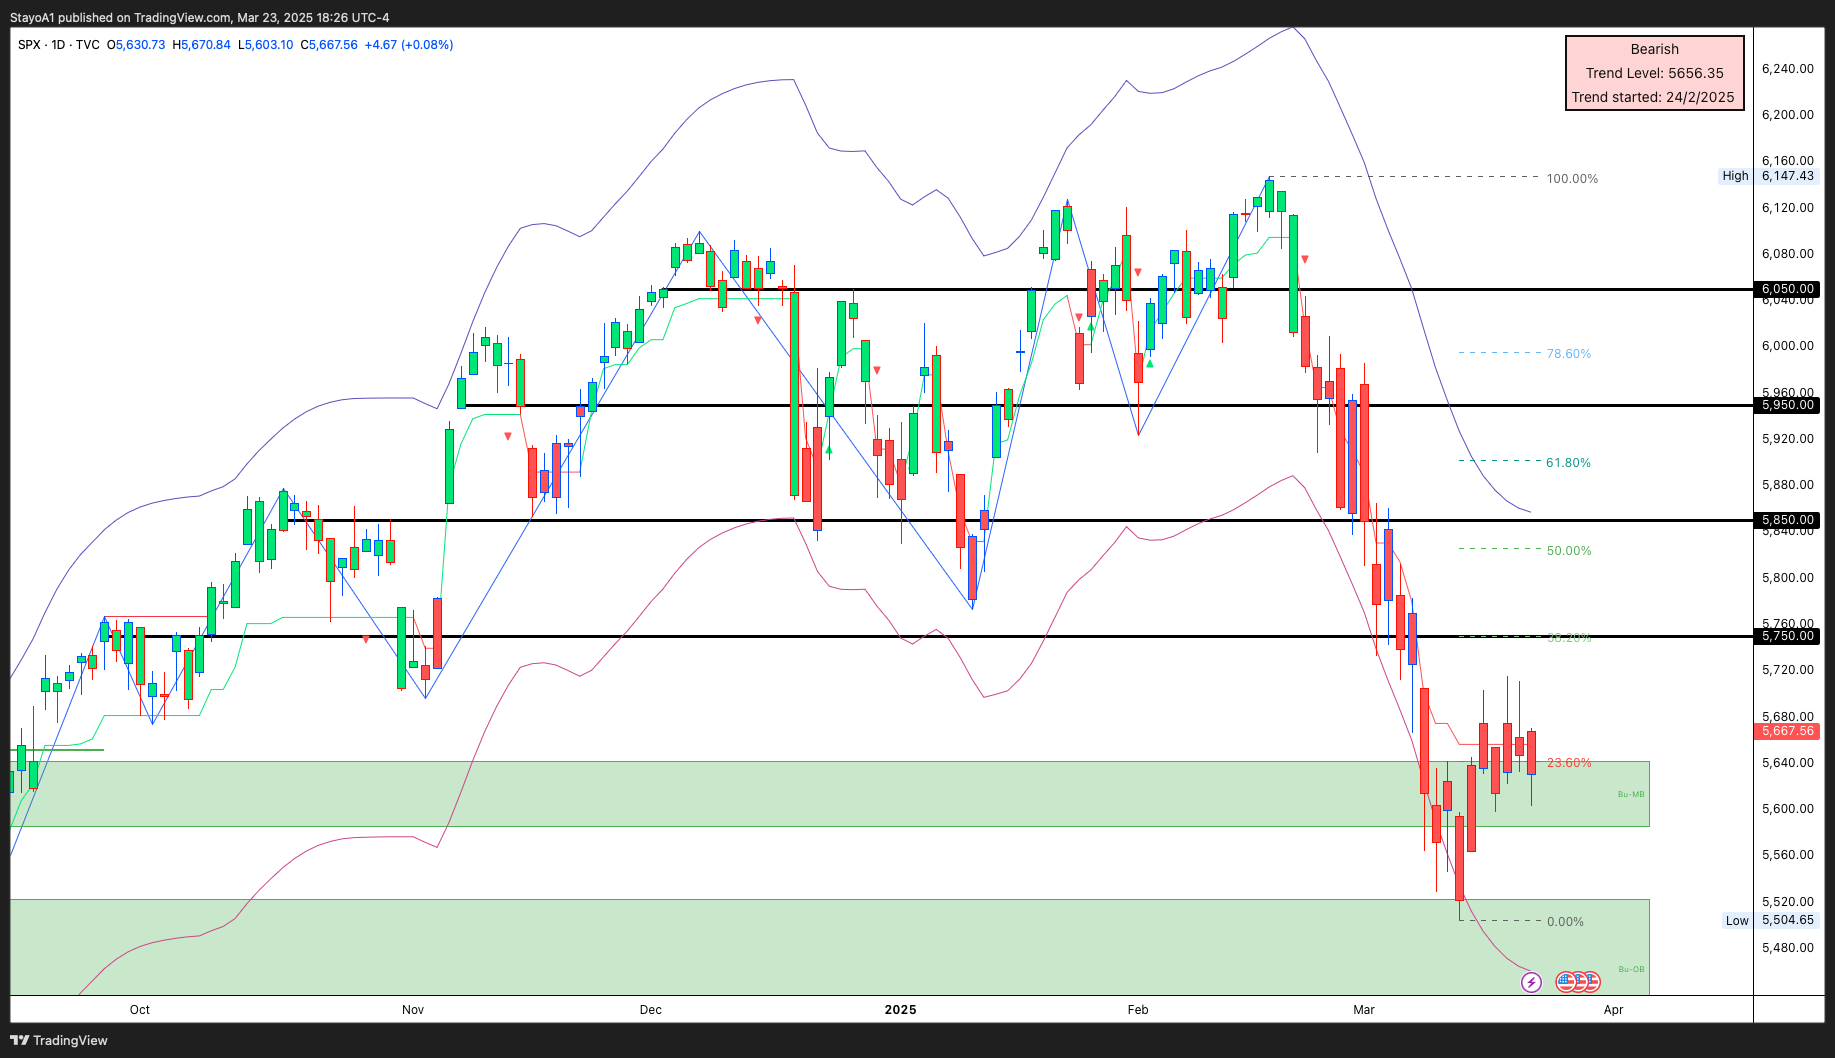
To see another run at new all-time highs, the market must push higher before April’s OPEX. Watch closely for a break above 5,950 and onward to 6,050.
If we fail at those levels, it’s wise to de-risk, as a sustained downtrend could follow through spring and summer months when trading activity declines and algorithmic trades dominate.
 Open original image in a new tab
Fed Watch: Historical Lessons & the Coming Pivot
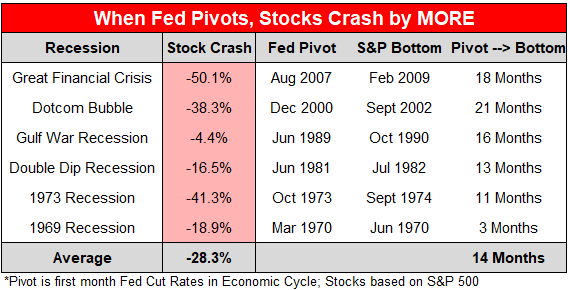
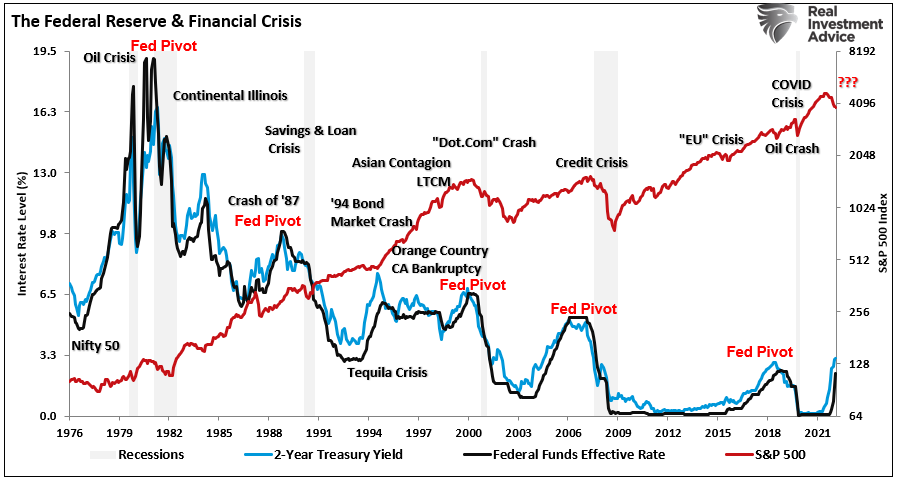
Historically, when the Fed pivots and begins cutting rates, markets tend to drop sharply:
 Open original image in a new tab
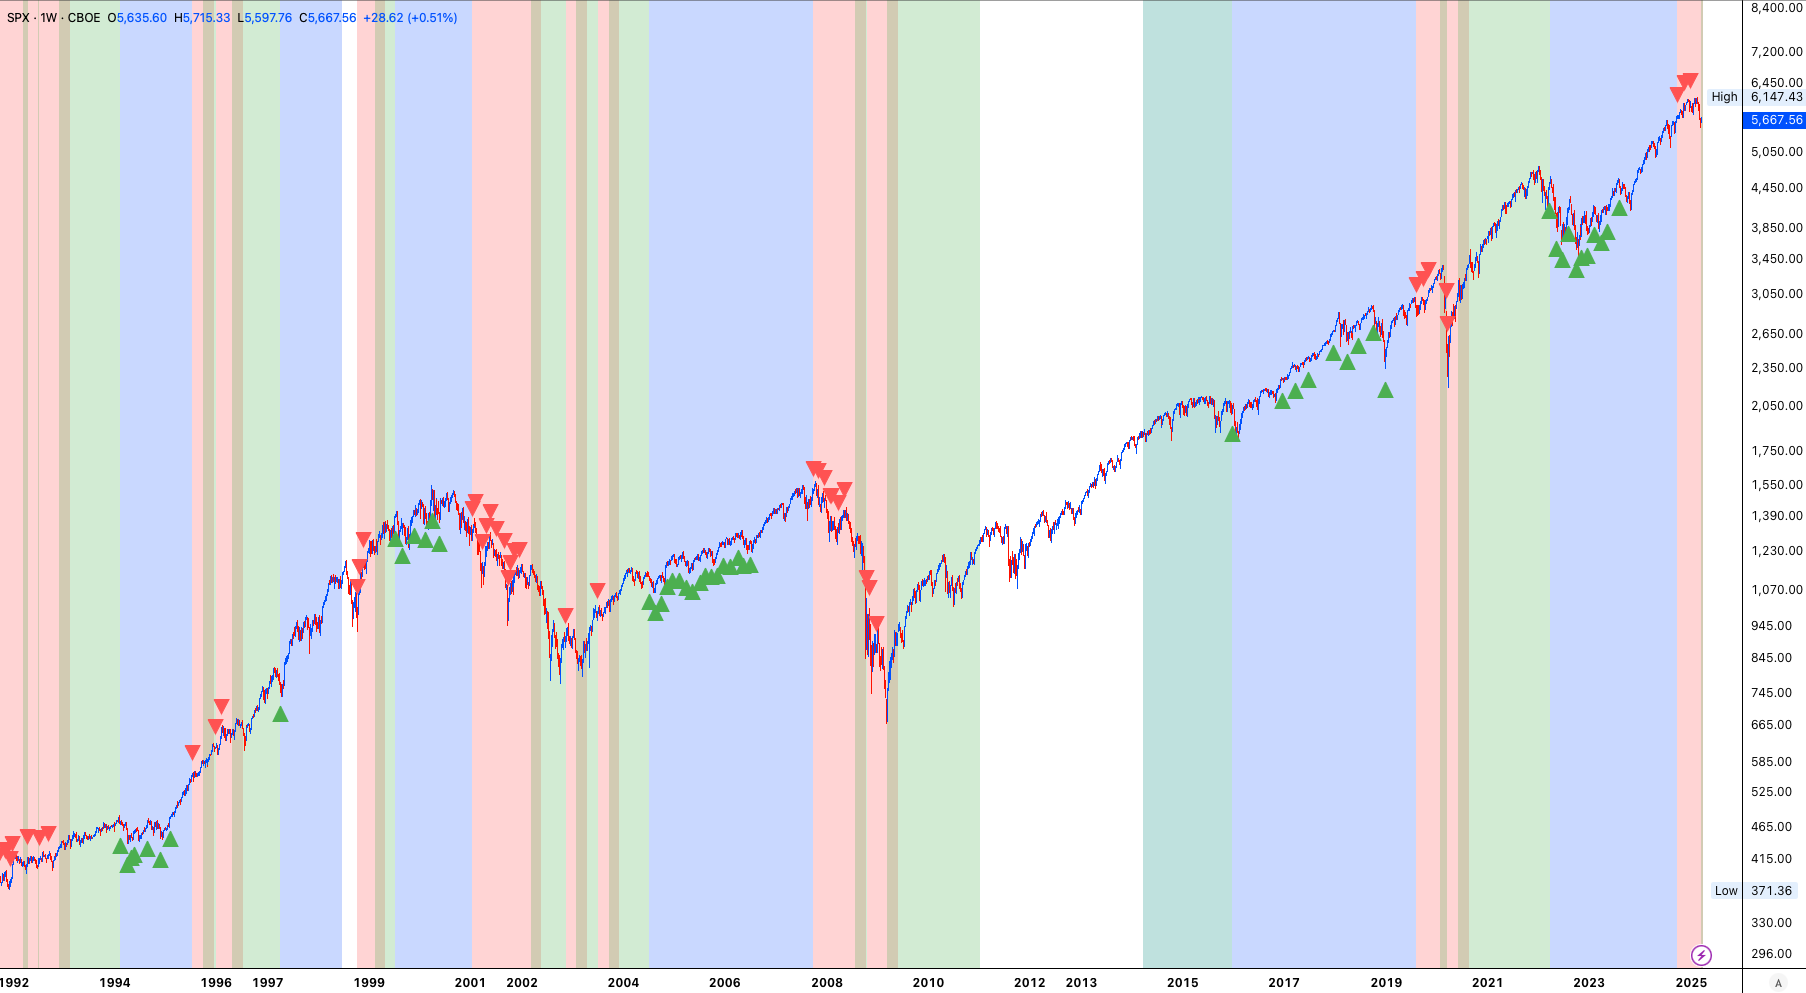
Average decline historically is around 28% over roughly 14 months. Given today’s rapid financial shifts, I anticipate a fast, orchestrated recession—a quick reset setting the stage for deregulation, lower rates, QE, and eventually a booming economy again.
 Open original image in a new tab
 Open original image in a new tab
Debt Bomb: The Trillion Dollar Question
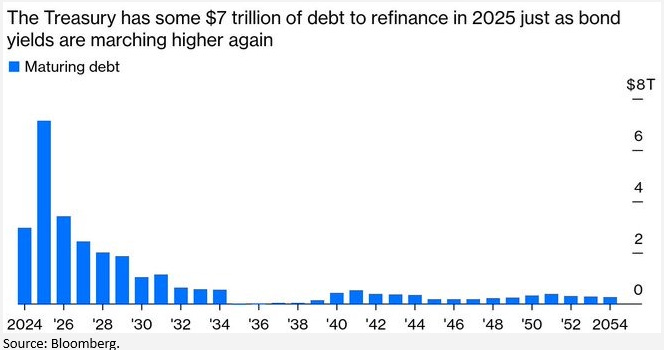
The US government urgently needs to refinance a massive amount of debt in 2025:
$9.2 trillion, or about 25% of total US national debt (~$36 trillion as of March 5, 2025).
Around 70% of this debt ($6.44 trillion) must be refinanced between January and June 2025.
Current interest rate average on debt: 3.2%, highest since 2010. Refinancing at current rates (4.5–5%) would be catastrophic for the national budget.
Expect the Fed and government to aggressively push rates down—likely prolonging market declines through structured sell-offs similar to what we saw in 2022. This scenario outweighs individual portfolio considerations short-term but is ultimately necessary to avoid severe financial consequences.
 Open original image in a new tab
Trading Tactics: Immediate Market Outlook
We’re currently around the lower Bollinger Band—expect a possible short-term bounce back to equilibrium (~5,800–5,950) into April OPEX. However, longer-term:
Above 5,950–6,050: Potentially bullish, new ATH possible.
Below these levels: Risk-off scenario dominates.
Currently, the chart looks bearish, resembling a bear-flag formation, but remember, deception is always part of the game.
 Open original image in a new tab
Crypto Corner: Bitcoin’s Next Move
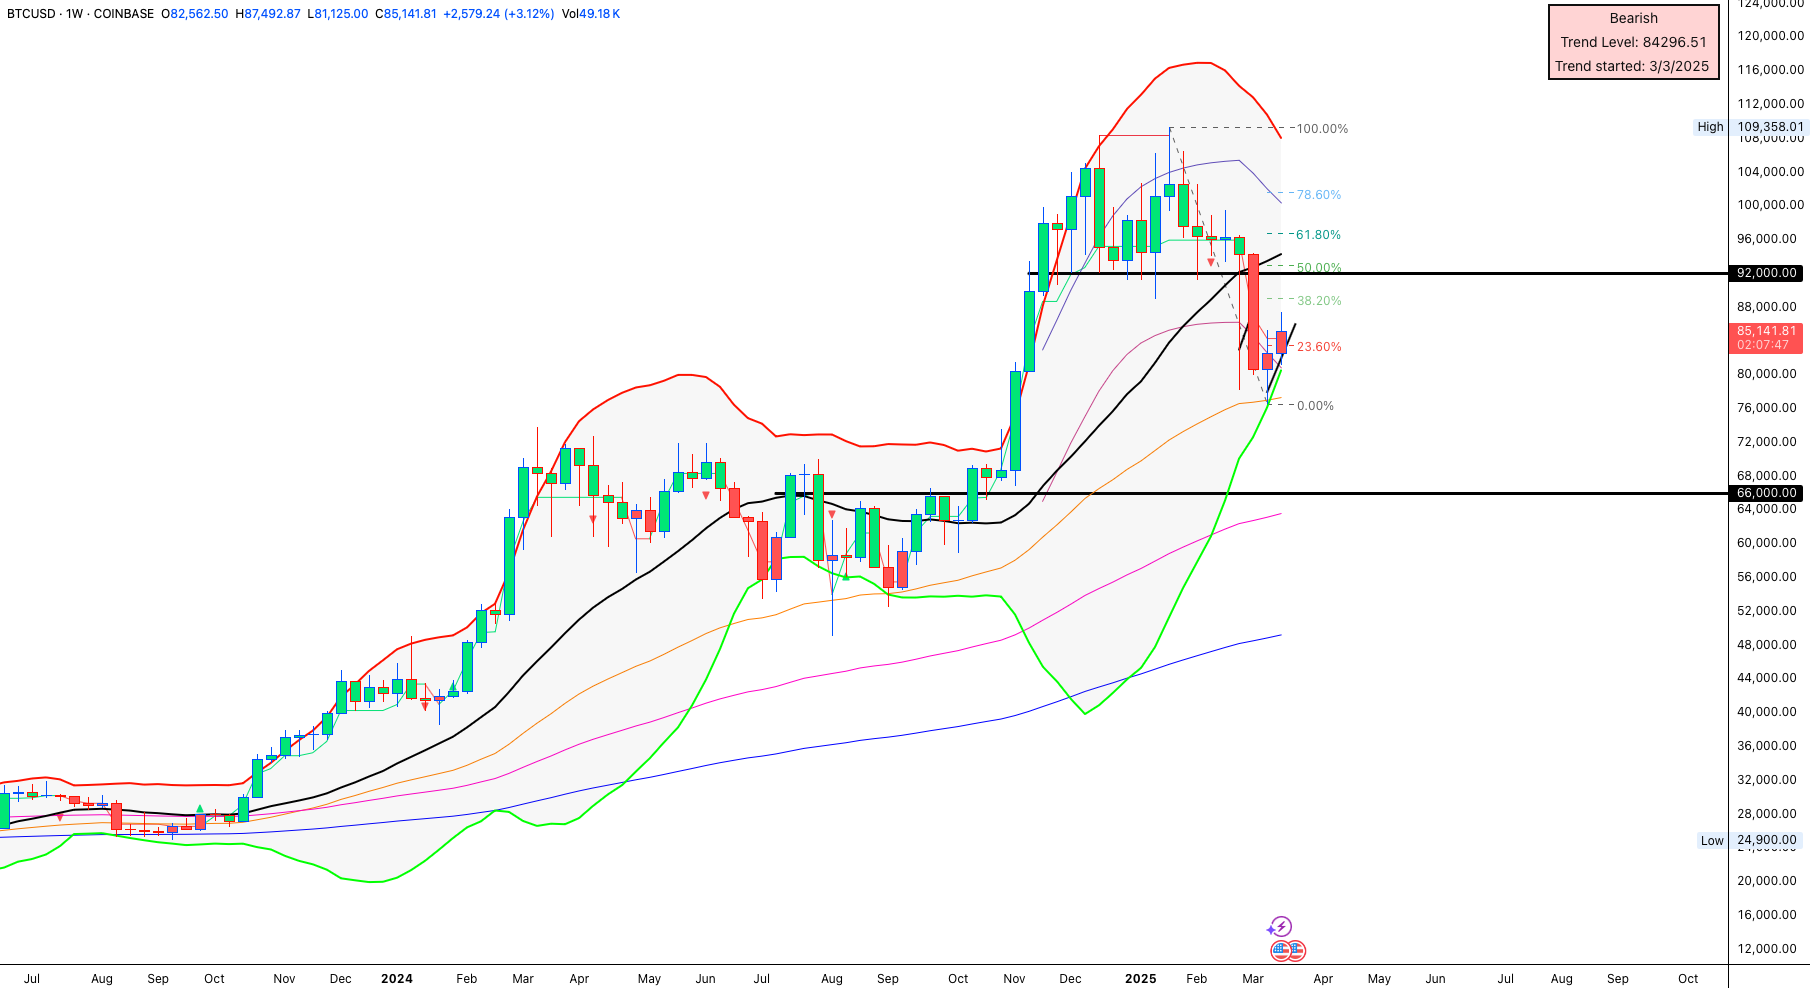
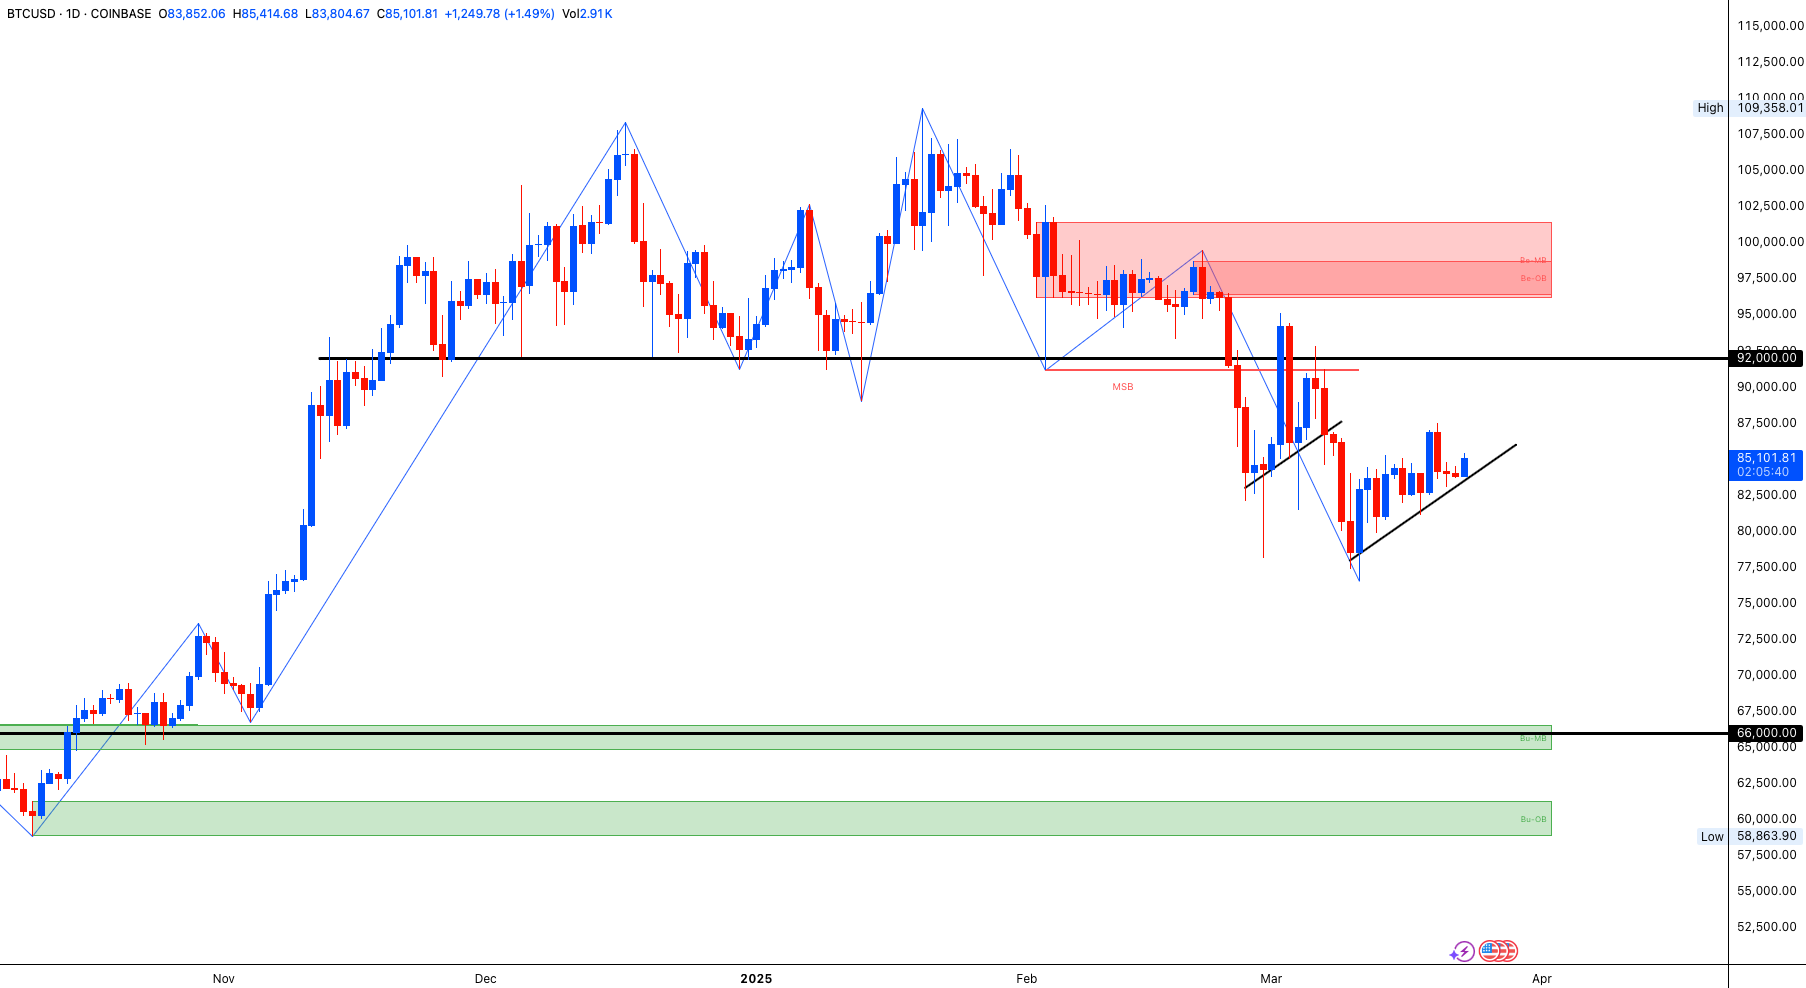
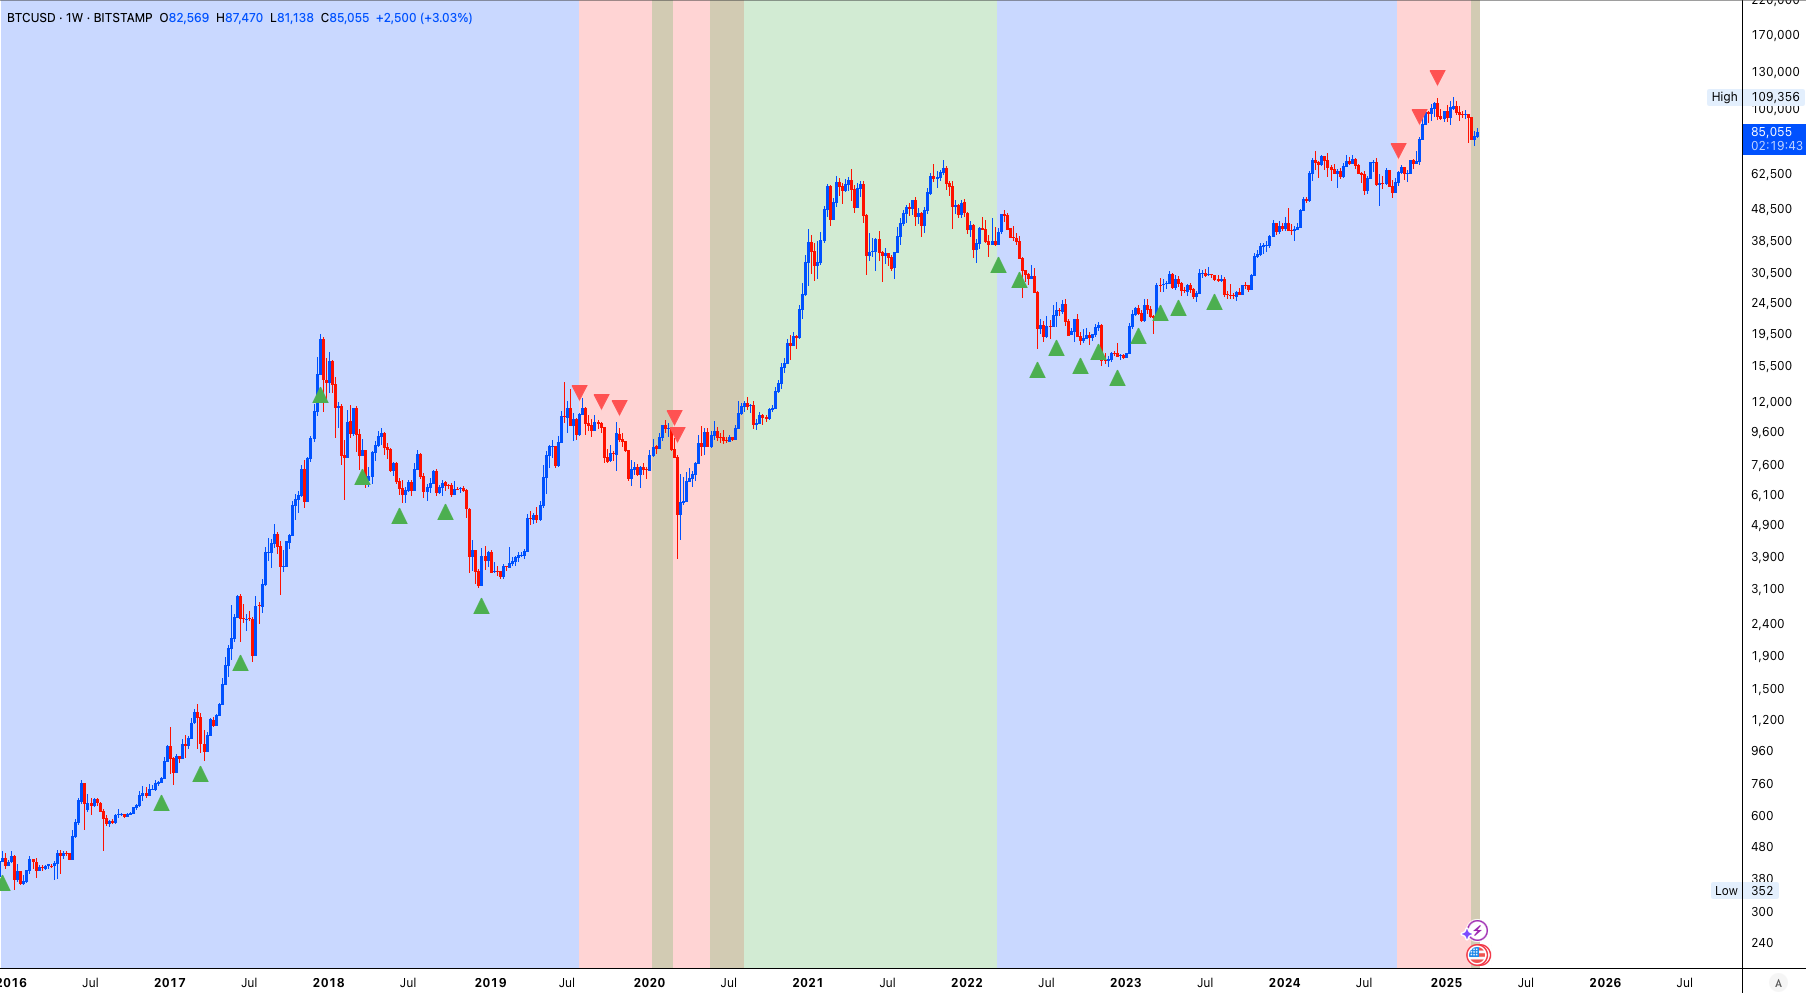
Bitcoin correlation to the market is notable but imperfect. Currently, Bitcoin needs to test $54k–$66k before considering fresh buys. Below $48k signals an accelerated sell-off risk. Patience is key.
 Open original image in a new tab
 Open original image in a new tab
 Open original image in a new tab
The Hustle Report: Where to Play (and Stay Away)
Long Opportunities:
Equal-Weighted S&P 500: Outperform as market rebalances away from Mag-7 mega caps.
Russell 2000 (IWM): Above 200, potential to retest ATH (244, potentially 290–300).
TLT: Awaiting re-entry around $85.
Energy (CVX, XOM): CVX strong above $165, XOM above $105.
US Steel: Above $38, benefits from protectionist policies vital to national security.
Cybersecurity (CIBR ETF): Strong long-term outlook. I will take a stab at $55.
Short Opportunities:
Carvana: Broken business model—ticking debt time-bomb.
Mag-7 & High-PE Tech: Nvidia (Cisco 2.0?), Airbnb, DoorDash (PE: 728!), Spotify (PE: 100), Shopify (PE: 288), Palantir backtesting ~$100 resistance.
Retail/Consumer Stocks: Walmart (35 PE!), Starbucks, Lowe’s, Home Depot, Kava—consumer squeeze imminent.
Financials: Banks (HSBC) due to toxic debt exposure; credit card companies vulnerable to interest rate caps.
Healthcare (XLV): Bearish below $150, potential drop to $125.
The Blueprint: Fibonacci Levels and Trade Setups
Break above 5,750 S&P: Bounce towards 5,850–5,950 possible.
Critical resistance: 5,950–6,050.
Leveraged ETFs (SQQQ): Approach cautiously due to rapid decay unless clear trends form.
 Open original image in a new tab
The Catalyst Watch: What’s Moving Markets
Watch Japanese Yen currency flows—trade unwind risks.
Inflation: Short-term cooling, but uptick possible soon.
Mag-7 liquidity reallocation to other sectors: Equal-weighted indices and Russell 2000 likely beneficiaries.
The Pulse: Your Turn to Weigh In
Got thoughts, recommendations (especially storage unit stocks!), or questions? Drop them in the comments below. Your feedback sharpens our community’s edge. Next article on this topic coming soon!
And remember, markets always demand respect—trade safe out there!
Disclaimer: The content provided in The Daily Condense is for informational purposes only and reflects our opinions, not financial advice. We are not financial advisors, and nothing herein should be construed as a recommendation to buy, sell, or hold any investment or financial product. Always conduct your own research or consult a qualified financial advisor before making any financial decisions.